
The information and opinions expressed below are based on my analysis of price behavior and chart activity
May Soybeans (Daily)
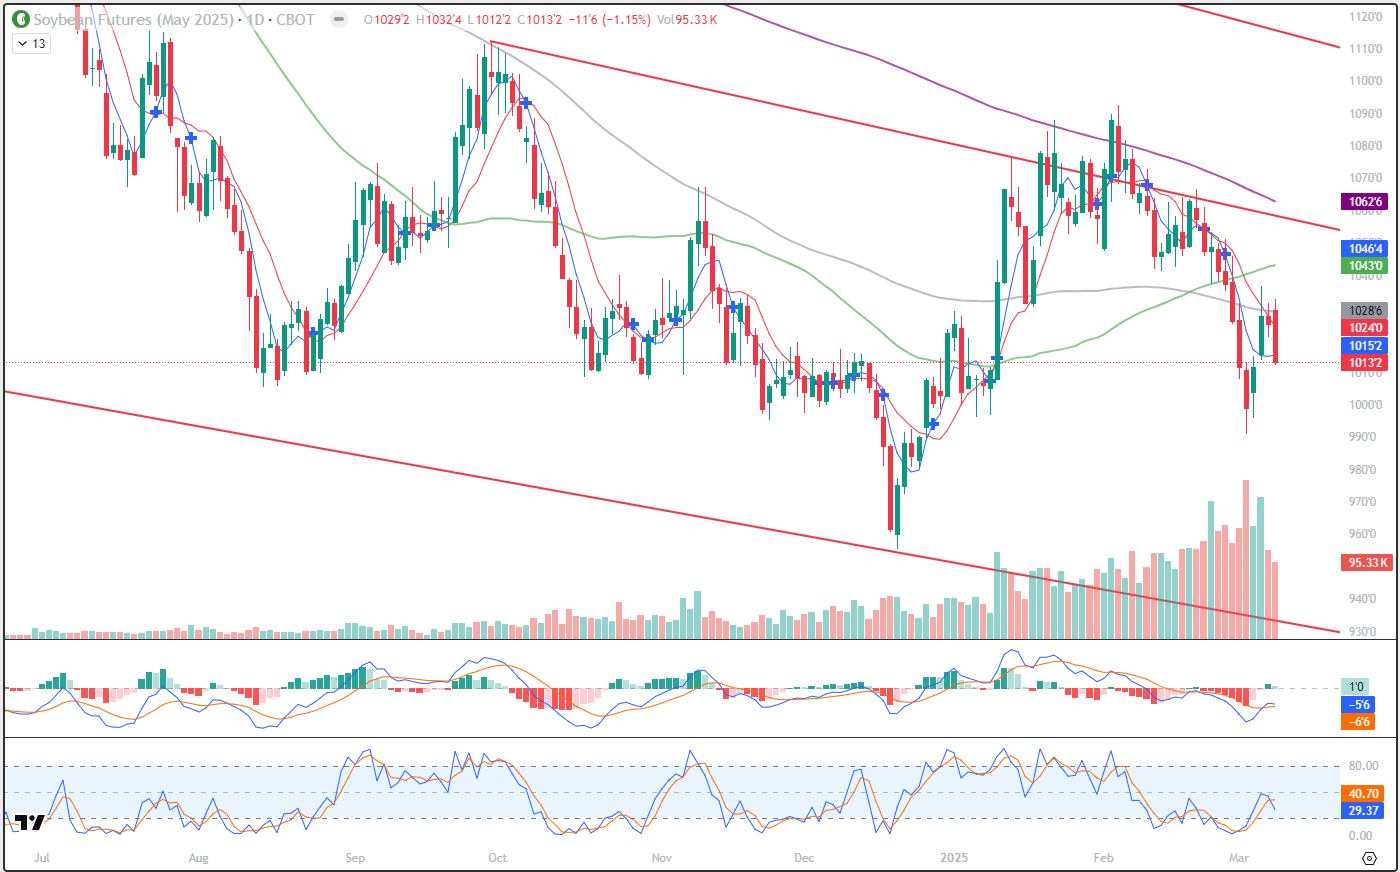
The May Soybean contract closed down 11 cents on Monday, at 10.14. Today’s bar can be considered a “Bearish Engulfment” and is typically a sign of further weakness to come. Overall, the trend appears to be pointing downward to my eye. Last week’s early selloff and subsequent bounce could be attributed, I think, to tariff exhaustion. Or perhaps traders were expecting them to be short-lived. Indeed, that low last week was posted on Tuesday, the first day the tariffs went into effect, allegedly. The mid-week rally was stopped, on a closing basis, by the 100-day moving average (grey) which is at 10.28 ¾ today. That same average was tested again last night, but the market backed away after the first 90 minutes or so. Today’s close below both the 5-day (blue) and 10-day (red) averages doesn’t not appear to be supportive to me. Those are located at 10.15 ¼ and 10.24 ¼, respectively. There is a WASDE report due out tomorrow at 11 AM central. This report usually has traders and hedgers focused on the ending stocks, both in the US and World, along with estimates for the South American production. Unless there is substantial change to the balance sheet, I would expect the South American production levels to be the main focus this year. Tariffs, and the surrounding uncertainty, have many market participants on the back foot, so to speak. Allegedly, they’ve been pushed back to April 7th. I’ve seen conflicting statements from the US Gov’t. One part will say that the tariffs could go away and not be a threat if the fentanyl issue is resolved satisfactorily. Another part will say that the 25% levies could be even higher. I’m not sure that I’m aware of anyone that has firm grip on the severity or length of how the tariffs will go. Aggressive and well-margined traders may do well to consider short positions with a risk/reverse near today’ high of 10.32 ½, keep in mind that is about 20 cents from today’s close, or roughly $1000 before commissions and fees. Traders with a smaller appetite for risk may do well to consider buying Put options. Should the market reverse higher, those puts can be used to reduce margin requirements on a long futures position.
May Soybeans (Weekly)
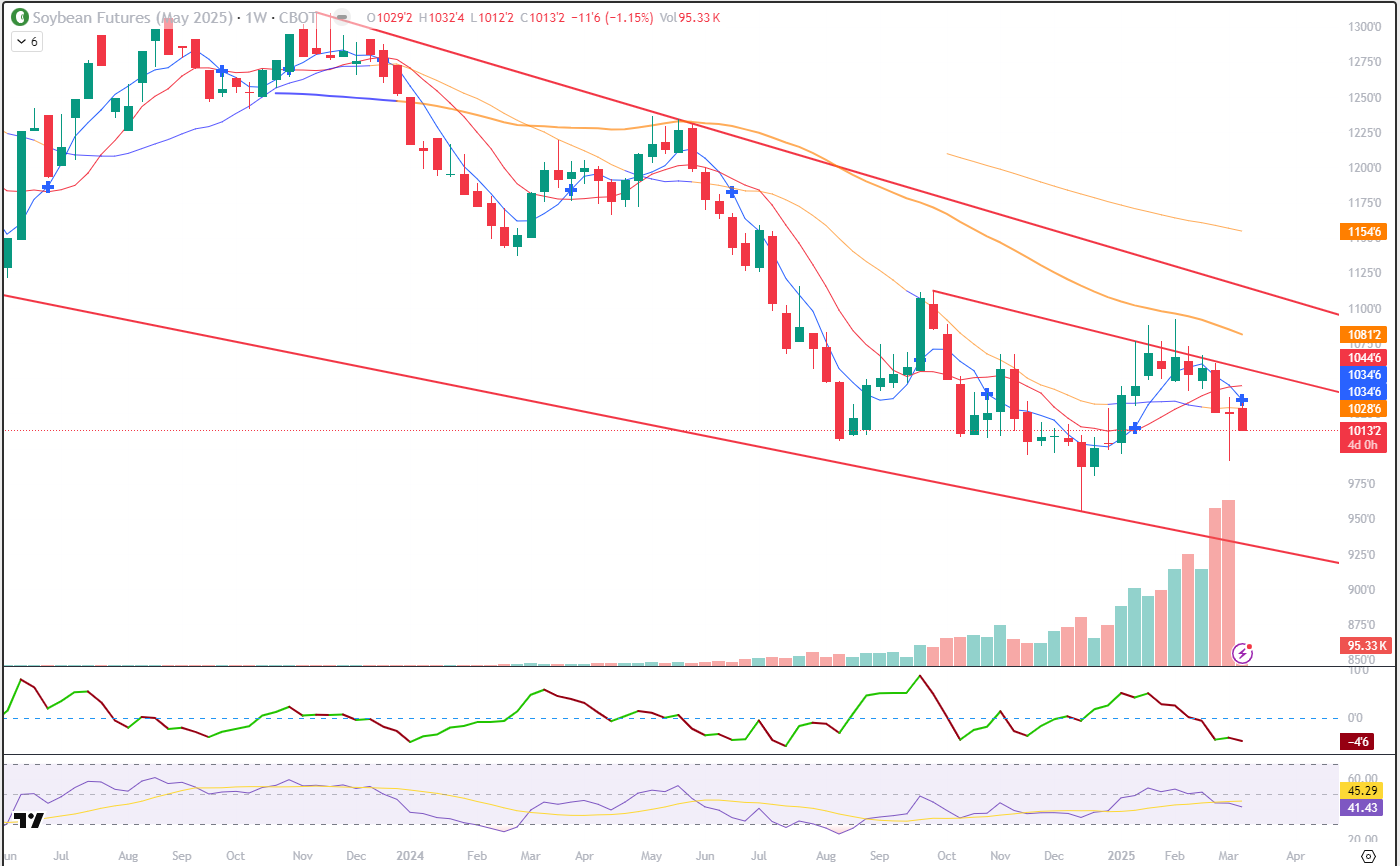
Last week, May Soybeans posted a weekly open and close within 1 cent (open was at 10.26, close at 10.25) with a 45 1.2 cent range. They did close well off the lows, giving some support t the bulls. This week, you might notice the blue cross just above today’s bar. That’s an indication that the 5- and 10-week moving averages have flipped to the bearish side. Those are near 10.35 and 10.45, respectively, and may offer some overhead resistance from here. The 20-week average, near 10.28 ¾, may also be a resistance level. Support on the weekly chart might be found near last week’s low of 9.91. Beyond that, perhaps the lows just before Christmas, 9.55 ½ and 9.80 ¼ would be targets. That lower red trendline is near 9.30, or so, and that’s drawn off of the spike lows that were hit in May of 2023 and December of 2024. Last week’s high of 10.36 ½ may prove pivotal, if the market can close above that, it may be able to negate the bearishness.
May Soybeans (Seasonal)
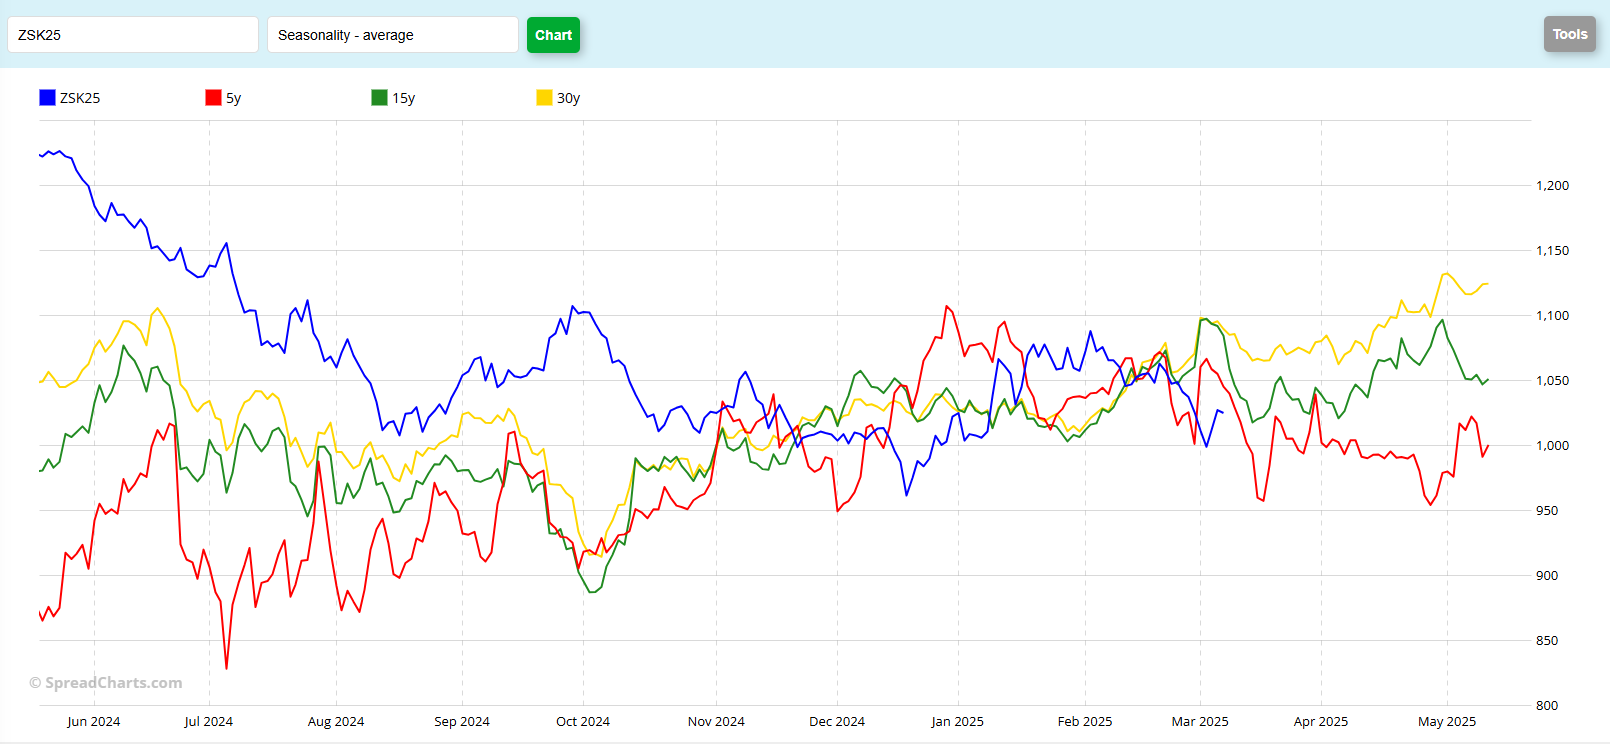
The seasonal chart for May Beans indicates to my eye that over the past 5 years (red) Soybeans generally trend lower until about mid-March, as shown by the low on/about March 18th. There’s usually a bounce until the end of the month, followed by weakness into option expiration near the end of April. This year, the May options expire on Friday, April 25th. The longer-term historicals, the 15-year (green) and 30-year (yellow) also tend toward weakness, although it doesn’t seem excessive to me, followed by strength until option expiry. I’m of the opinion that the seasonals have been somewhat “out of sync” with the current contract making highs or lows at an odd time. For that reason, this chart doesn’t give me many clues as to what traders should expect. Do you see something different?
Jefferson Fosse Walsh Trading
Direct 312 957 8248 Toll Free 800 556 9411
jfosse@walshtrading.com www.walshtrading.com
Walsh Trading, Inc. is registered as a Guaranteed Introducing Broker with the Commodity Futures Trading Commission and an NFA Member.
Futures and options trading involves substantial risk and is not suitable for all investors. Therefore, individuals should carefully consider their financial condition in deciding whether to trade. Option traders should be aware that the exercise of a long option will result in a futures position. The valuation of futures and options may fluctuate, and as a result, clients may lose more than their original investment. The information contained on this site is the opinion of the writer or was obtained from sources cited within the commentary. The impact on market prices due to seasonal or market cycles and current news events may already be reflected in market prices. PAST PERFORMANCE IS NOT NECESSARILY INDICATIVE OF FUTURE RESULTS. All information, communications, publications, and reports, including this specific material, used and distributed by Walsh Trading, Inc. (“WTI”) shall be construed as a solicitation for entering into a derivatives transaction. WTI does not distribute research reports, employ research analysts, or maintain a research department as defined in CFTC Regulation 1.71.