
The information and opinions expressed below are based on my analysis of price behavior and chart activity
November Soybeans (Daily)
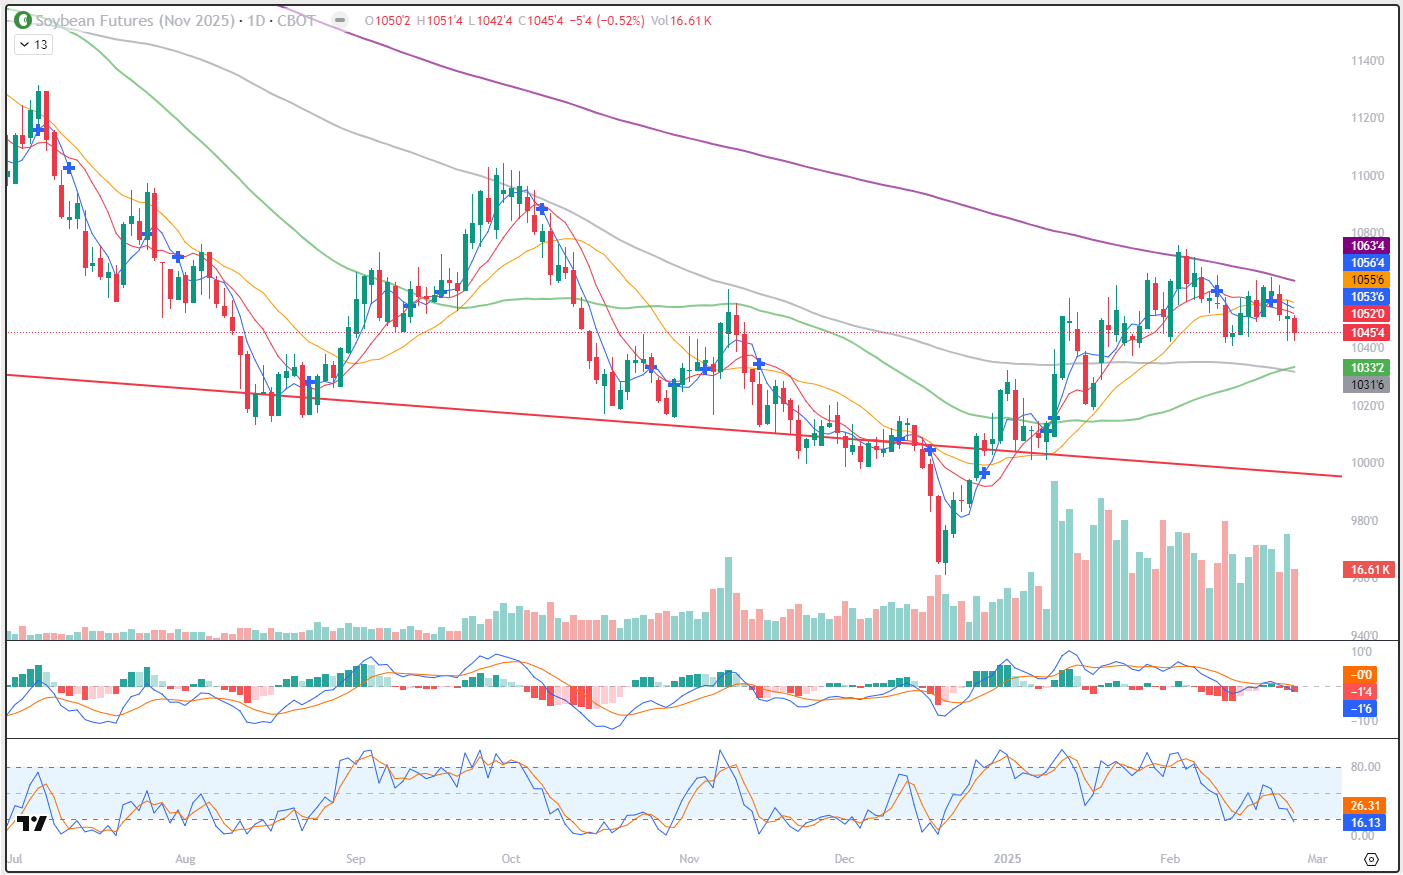
Today, November Soybeans closed at 10.45 ½, down 5 ½ cents. This is the weakest close for new crop Beans since Feb 13th. However, you may notice that the 50-and 100-day moving averages (green, grey. 10.33 ¼, 10.31 3/4, respectively) made a bullish crossover yesterday. Typically, that’s a bullish sign of trend change. Over the past month, you can see that prices have tested the 200-day average on 3, maybe 4 days. The 4th day was last Friday, prices got close but did not touch the 200. Today, that average is at 10.63 ½. The 5- and 10-day (blue, red) averages are still, technically, in bullish territory, but they are now above the market, potentially offering resistance at 10.53 ¾ and 10.52, respectively. The big fat number at 10.50 might get in the way, as well. The MACD indicator (1st subgraph) is pointing lower at the moment, and the Stochastics (lowest subgraph) are, as well. You can also see the orange moving average, which is at 10.55 ¾ today. The moving average will be the Crop Insurance price for Nov Beans at the end of February. If you don’t know, crop insurance prices are set for Beans by using the average price for the month of Feb. If the month ended today, that insurance price would be 10.55 ½, roughly 1.00 lower than last year. Producers, how does that compare with what your pencil says? There are a couple of fundamentals on the horizon that will likely affect prices. Exports, planting/acreage intentions and tariffs jump to the front of my mind. Never mind the large Brazilian crop that being harvested now. Exports have been decent, the “trade” seems to expect a sizable decrease in acreage and tariffs…well, your guess may be as good as mine. Export Sales data will come tomorrow morning, as it usually does on Thursdays. The USDA outlook conference begins tomorrow, as well. Expect the acreage estimate to come from there. It’s not the “official” Prospective Plantings report (Mar 31st) but it is the first look at what the USDA is thinking. To my eye, the market is “stuck” between 10.35-10.65 right now. Perhaps an Option Straddle (buying both a Call and a Put, with an eye toward keeping the one that works) would be a good choice right now.
November Soybeans (Weekly)
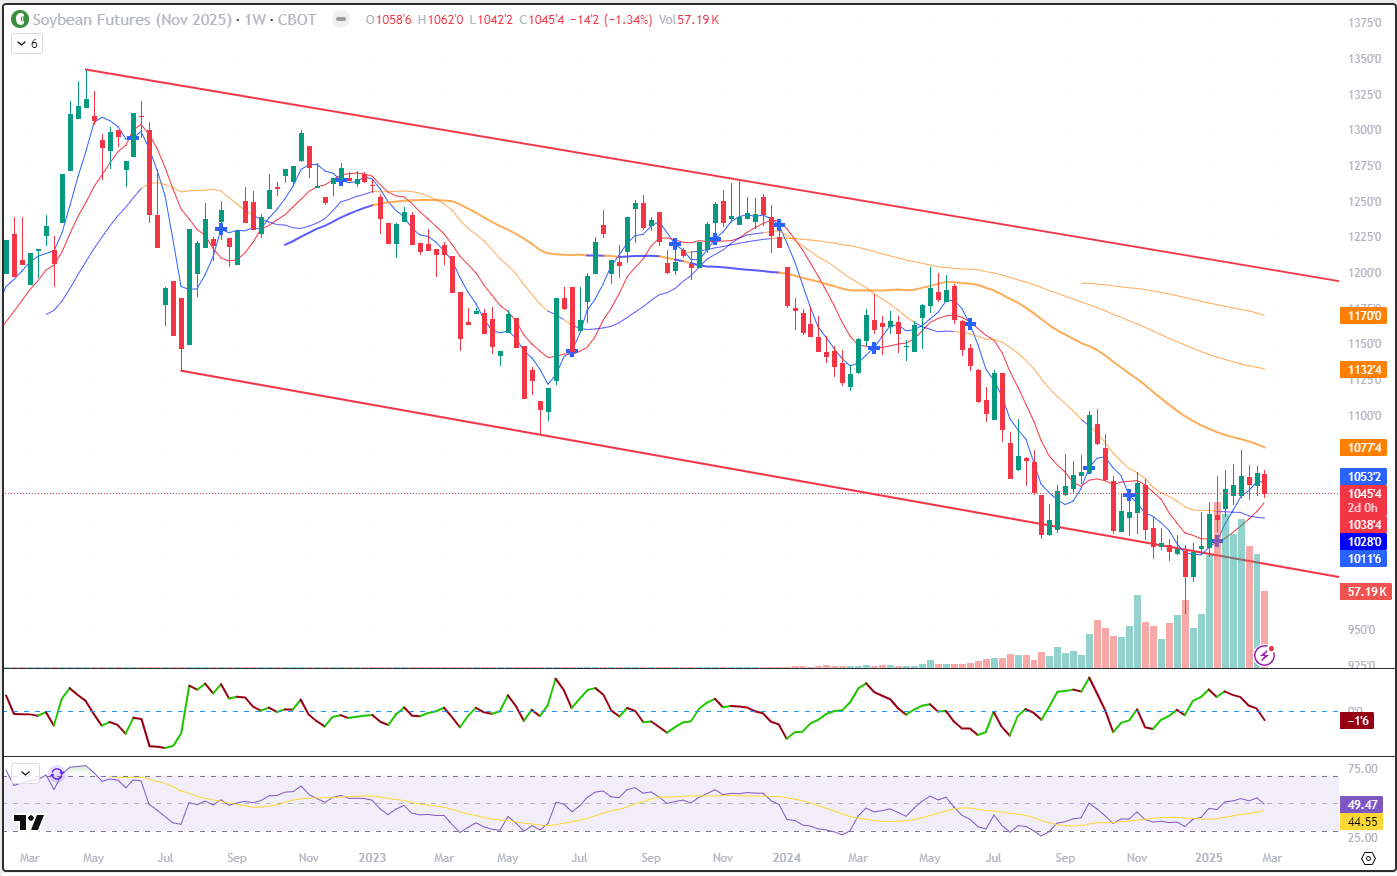
The weekly chart, I think, really illustrates the Bean market. You can clearly see the trading range as denoted by the red trendlines. However, the lower one doesn’t even account for the low lows last August or December. Today, those values are roughly 9.95 on the low side and 12.00 on the high side. Overall, the downtrend is still dominant, to my eye. Prices have been coming up since the December low (9.61) but they’ve been unable to set new highs for the move so far. The 5-and 10-week moving averages are below the market, having crossed into bullish territory in the 2nd week of January, as denoted by the blue cross at 10.11 3/4. But you might notice that the 5-week is above the market at 10.53 ¼, while the 10-week is below at 10.38 ½. The 20 week (now blue, was orange) is offering potential support near 10.28. The longer-term 50-, 100 and 150- week averages are well above the market, with the closest being 10.77 ½. Prices haven’t moved significantly for about 6-7 weeks and the large “wicks” on most of the bars or candles during this period indicate selling pressure to me.
November Soybeans (Seasonal)
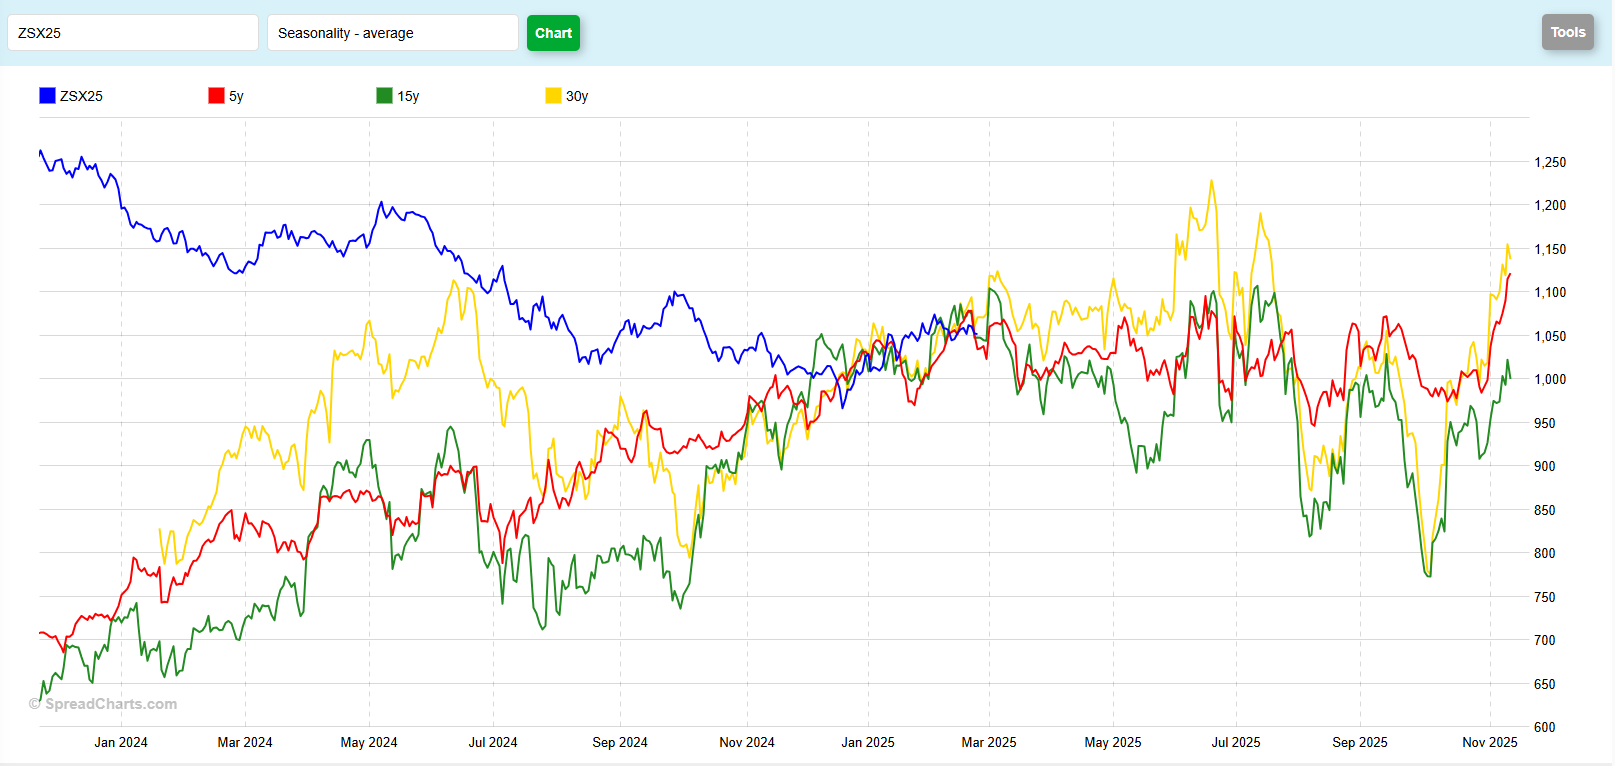
The seasonal chart tells me a few things. The current November contract appears to have gotten “back in line” with the historical patterns in the middle of December. As you can see, before that, the current market has been trending lower for as far back as this chart goes. This displays a little over 2 years of data. It paid no mind to historical tendencies in 2024 until very late in the year. This chart indicates a little bit of price disruption/distortion that seems to occur when the March contract goes into delivery, right about now. Looking forward over the next two months, I think it’s less clear. The 5-year pattern (red) seems to indicate a small bump in prices in the first part of March, then a drop to lows mid-March before a mild rally until the end of April. The 15-year, (green) shows price weakness for nearly all of March, followed by a choppy/higher move by the end of April. The 30-year (yellow) also seems to hit a low in late March\, before rallying back near the early March highs by the end of April. I don’t think any of them accurate reflect the market we have now. I think that the 5-year is going back through a period of (mostly) ridiculously high prices due to outside factors, ie Covid and Russia/Ukraine war. I believe that the 30-year reflects economics and price levels that are no longer valid, due to inflation, primarily, but also there’s been a shift in supply/demand. Inflation is something that was/is/will be a permanent feature. But comparing 2025 economics to 1995, 2005 or 2015 seems like a stretch to me. And 10 years ago, the US was the leading producer. We lost that in 2019/2020. I’m honestly not sure what to think of the 15-year pattern, other than it shows lower lows and lowers highs from now, pretty much until contract expiration.
Jefferson Fosse Walsh Trading
Direct 312 957 8248 Toll Free 800 556 9411
jfosse@walshtrading.com www.walshtrading.com
Walsh Trading, Inc. is registered as a Guaranteed Introducing Broker with the Commodity Futures Trading Commission and an NFA Member.
Futures and options trading involves substantial risk and is not suitable for all investors. Therefore, individuals should carefully consider their financial condition in deciding whether to trade. Option traders should be aware that the exercise of a long option will result in a futures position. The valuation of futures and options may fluctuate, and as a result, clients may lose more than their original investment. The information contained on this site is the opinion of the writer or was obtained from sources cited within the commentary. The impact on market prices due to seasonal or market cycles and current news events may already be reflected in market prices. PAST PERFORMANCE IS NOT NECESSARILY INDICATIVE OF FUTURE RESULTS. All information, communications, publications, and reports, including this specific material, used and distributed by Walsh Trading, Inc. (“WTI”) shall be construed as a solicitation for entering into a derivatives transaction. WTI does not distribute research reports, employ research analysts, or maintain a research department as defined in CFTC Regulation 1.71.