
The information and opinions expressed below are based on my analysis of price behavior and chart activity
April Live Cattle (Daily)
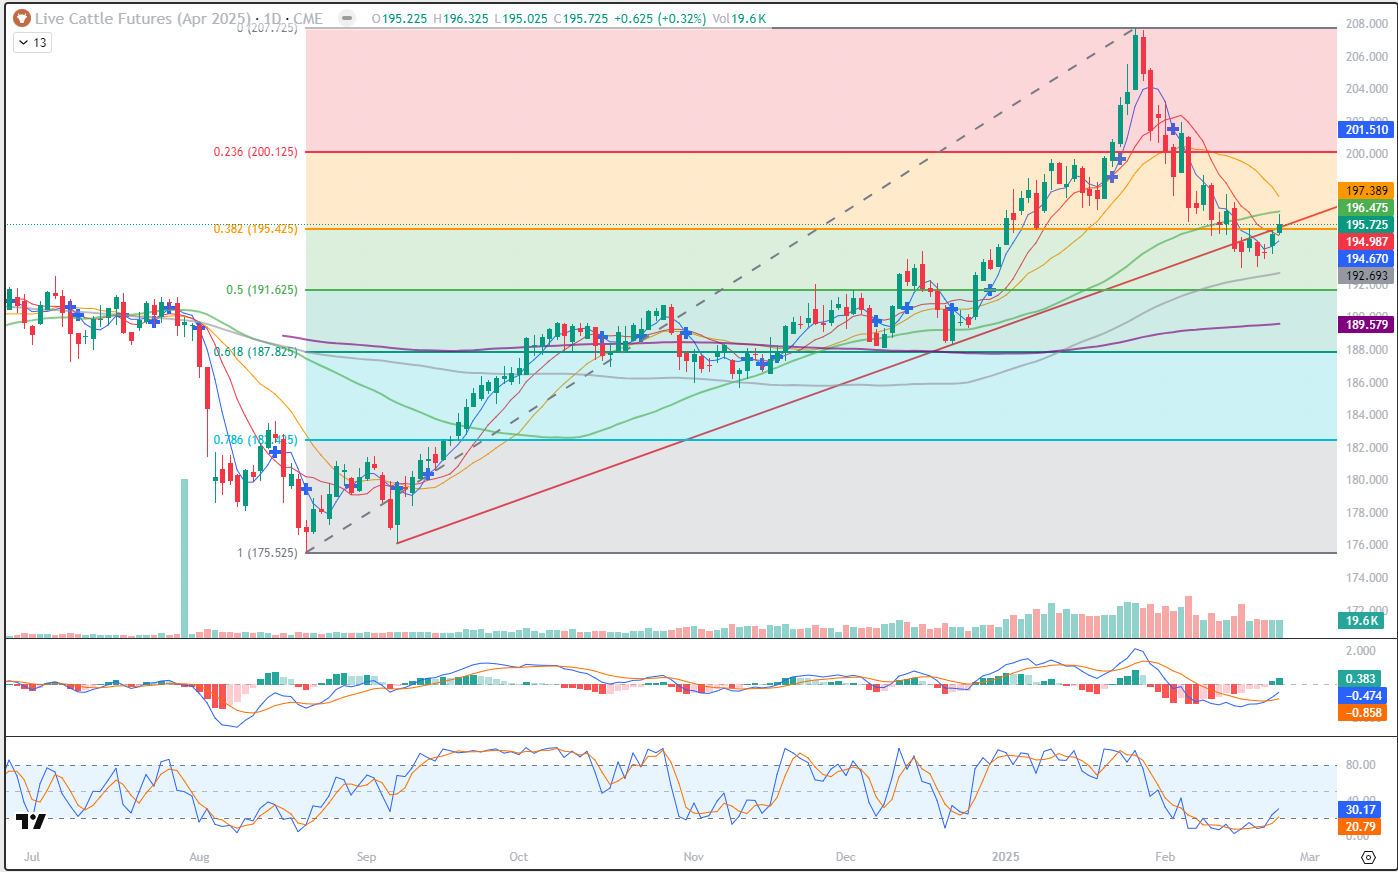
April Cattle closed at 195.725 on Tuesday, up 0.625. Prices have been moving higher this week, following last Friday’s Cattle on Feed report. I don’t think that report contained many surprises, as the overall herd is down about 1% y/y, with Placements up 2% y/y and Marketings up 1% y/y. Friday’s trade ended up posting what I call an equilibrium day. It wasn’t quite a Doji, as the opening and closing prices were not the same (2 ticks apart), but the downward momentum that was in place was stopped. Following a day like that, Doji or “eq day”, I’ve found that waiting for a directional close, outside of the Doji or eq range, will usually dictate the next market direction. Yesterday was a positive close above Friday’s range, giving me an initial indication that Cattle prices want to go up. Today’s trade wasn’t dramatically bullish, but prices have moved up. As you can see by the chart, the April got up close to the 50-day average (196.475) and pulled back a little. Prices are holding along the red trendline, drawn off of the Sept-late Dec lows, for the past 7 sessions. We did close above the 5-and 10-day moving averages, (blue/red) and those may offer support near 194.670 and 194.987, respectively. They are still in “bearish” territory, but the MACD indicator, in the first subgraph, is hooking back higher. Stochastics, just below that, have been oversold since Feb 6th and are also hooking back up. Looking over the chart, I also notice that this market seems to “like” double bottoms or tops. I see that in the lows from last Aug-Sept, the lows from early Nov and also in the highs in late Jan. Is it possible that last week’s lows may do the same thing? We’re only 2 days “up” right now, so that remains to be seen. Aggressive and well margined traders may do well to consider long positions near these current levels. To my eye, your initial risk is a close below Friday’s low of 193.575, or perhaps last Tuesday’s low of 193.025 might be a hard risk/reverse stop. Producers may do well to consider lifting futures hedges near these prices, with an eye toward replacing them at higher levels. I would put those short hedges right back on, should yesterday’s low of 193.875 get hit again.
April Live Cattle (Weekly)
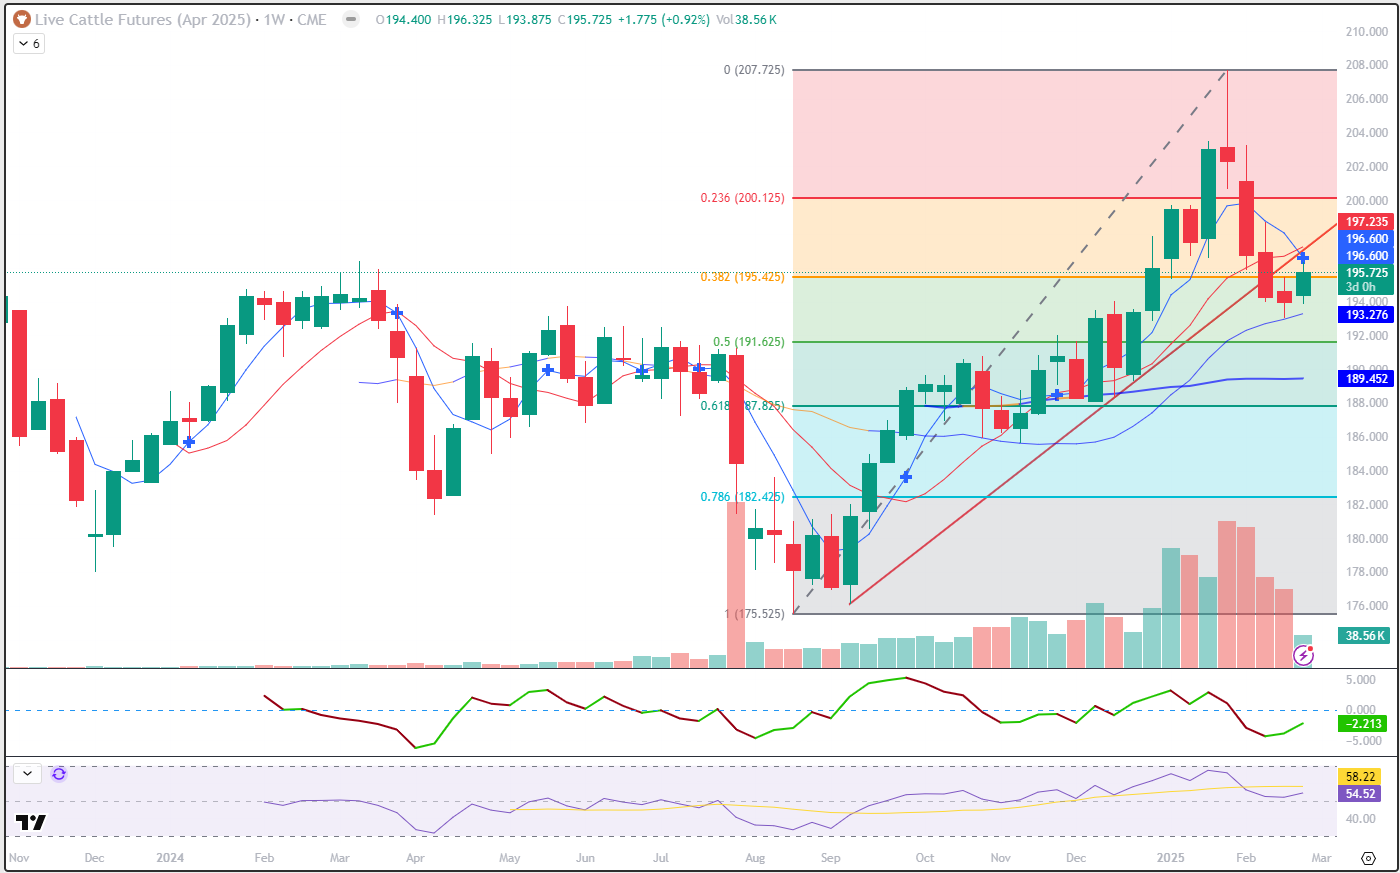
After 4 weeks of “red” trade, this week is turning April Cattle back to green. Yes, we still have 3 days left in the week, but it is a start. Looking at the chart, 4 consecutive weeks of red, or downward movement, is about all this contract has been able to manage. In fact, I see that only once in the April contract, mid-Mar to early-April. That leads me to believe that perhaps we’re done going down, for now. However, the bears out there may be encouraged by the 5-and 10-week averages (blue, red, at 196.600 and 197.235, respectively) making a bearish crossover this week. You can see that denoted by the blue cross in this weeks bar. Prices did hold support last week, when the 20-week average was tested, today that’s near 193.275. That’s the blue line just under the recent lows. April Cattle are also trading back up above the 38% Fibonacci retracement, 195.425, which may offer some nearby support. The Forecast Oscillator, first subgraph, is turning back up, and the 14 day RSI just under that is as well. The selling pressure, as evidenced by the trade volume, seems to be drying up. Volume has steadily declined since the market made the spike high 5 weeks (bars) ago. Given the long side bias that is reflected in the Commitment of Traders report, I would have expected more price pressure if the “funds” were actively exiting those longs. That could still appear, but it hasn’t yet.
April Live Cattle (Seasonal)
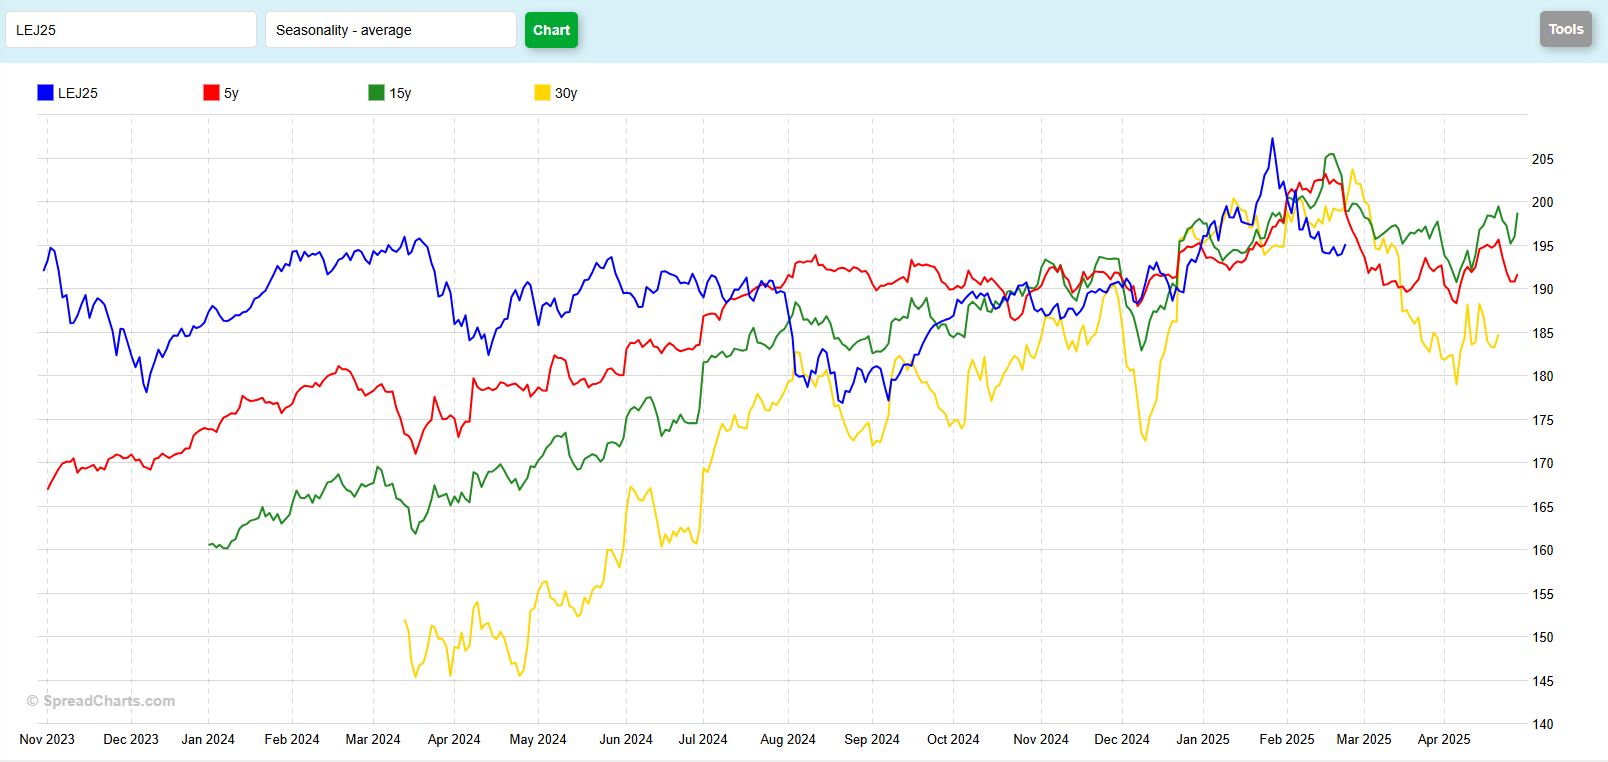
To my eye, this seasonal chart shows the market out of sync with the typical historical patterns until about August-September of last year. Since then, it does seem to have re-aligned somewhat. Not exactly, perhaps, though. While the pattern alignment has gotten a little better, the peaks and valleys are not exactly lined up. Looking forward, the historical patterns suggest a top occurring soon. But I think you might notice that the current contract (blue) made it’s peak on Jan 28th, about 3-4 weeks earlier than the historicals. Those 5-, 15- and 30-year patterns also show weakness until about the first week of April. In fact, the 30-year data indicates that tomorrow is the historical peak, (yellow, 203.710) followed by a decline until April 4th. That 30-year pattern April low is right near 179.000, with the 5-year (red) near 188.000 and the 15-year (green) near 191.000. I’m not certain that those are price targets for the current contract, I think they’re more of a general road map. Measured from “peak to valley” the 5-year suggests a drop of about 15.000, the 15-year suggests a decline of 14.780 and the 30-year suggests a 22.000 selloff. For reference, the current April had fallen 14.700 from the Jan 28th high (207.725) to the Feb 18th low (193.025) which indicates to me it is possible the seasonal price weakness has passed. What do you think the seasonals show?
Jefferson Fosse Walsh Trading
Direct 312 957 8248 Toll Free 800 556 9411
jfosse@walshtrading.com www.walshtrading.com
Walsh Trading, Inc. is registered as a Guaranteed Introducing Broker with the Commodity Futures Trading Commission and an NFA Member.
Futures and options trading involves substantial risk and is not suitable for all investors. Therefore, individuals should carefully consider their financial condition in deciding whether to trade. Option traders should be aware that the exercise of a long option will result in a futures position. The valuation of futures and options may fluctuate, and as a result, clients may lose more than their original investment. The information contained on this site is the opinion of the writer or was obtained from sources cited within the commentary. The impact on market prices due to seasonal or market cycles and current news events may already be reflected in market prices. PAST PERFORMANCE IS NOT NECESSARILY INDICATIVE OF FUTURE RESULTS. All information, communications, publications, and reports, including this specific material, used and distributed by Walsh Trading, Inc. (“WTI”) shall be construed as a solicitation for entering into a derivatives transaction. WTI does not distribute research reports, employ research analysts, or maintain a research department as defined in CFTC Regulation 1.71.