
The information and opinions expressed below are based on my analysis of price behavior and chart activity
May Corn (Daily)
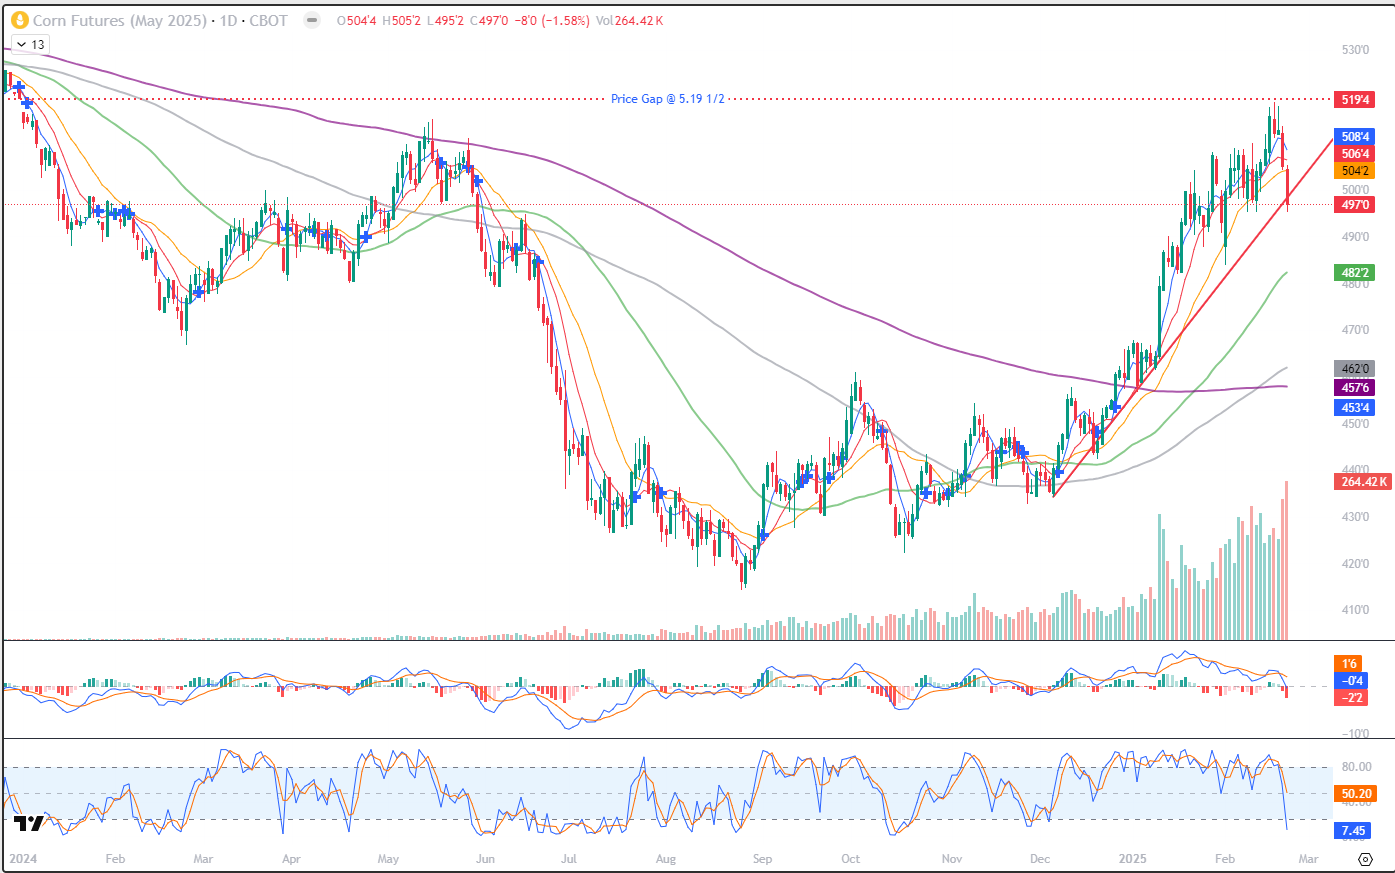
May Corn futures closed at 4.97 today, down 8 cents. You might notice that the volume over the past two sessions has spiked quite a bit higher. Some of this weakness is due to contract rollover, as the March options expired this past Friday and First Notice Day for the March Futures is this coming Friday. Traders who don’t want to risk delivery will need to exit that month by Friday. Last week the market posted a high of 5.18 ¾, not quite filling the price gap at 5.19 from the last trading day of 2023. To my eye, the last 4 days (bars) have not been bullish because we’ve seen closes very near the lows of the day, each of those day. Today’s price action took Corn prices well below the 5- and 10-week moving averages (blue/red, 5.08 ½ and 5.06 ½, respectively) and the close below 5.00 is not particularly supportive. You may also see the trendline support, drawn off of the Dec 5th-Jan 9th lows, and notice today’s close below that trend. Corn traders also have any eye to this week’s USDA Agricultural Outlook (Thurs-Fri) where we think to get the first look at what the USDA expects for US acreage. The “official” number will come out at the end of March, with the Prospective Plantings report. There are a few private estimates that have been released, which are pegging US Corn acreage to be higher this year. For example, CoBank set their estimate at 94.55 m/acres. If that number is correct, that’s almost 4 million MORE Corn acres this year. Unless we have some severe weather/planting problems this spring, I’m struggling to see what would be long-term fundamentally bullish in Corn. Also, many markets, including Corn, are wondering about tariffs that were, allegedly, set to begin this weekend. I guess we’ll have to wait and see about those. In addition to the resistance numbers that I mentioned above (5.00, 5.06 ½, 5.08 ¼, 5.19) Support may be found near 4.94 (23% Fibonacci retracement), 4.90 (nice, fat, round number), the 50-day moving average (green) at 4.82 ¼ and then the 38% Fibonacci number at 4.78 ¾. South American production seems to be progressing well, with IMEA pegging the Safrinha crop plantings in Brazil near the 67% complete mark In Mato Grasso. Still below last years pace (was 80%), but good progress on par with the 5-year average of about 70% complete. On the bullish side, notice that the 100- and 200- day averages (grey, purple) crossed into “bullish” territory on Feb 13th. On the bearish side, Stochastics (lowest subgraph) and MACD (just above that) have accelerated down in the past few days, indicating more potential weakness.
May Corn (Weekly)
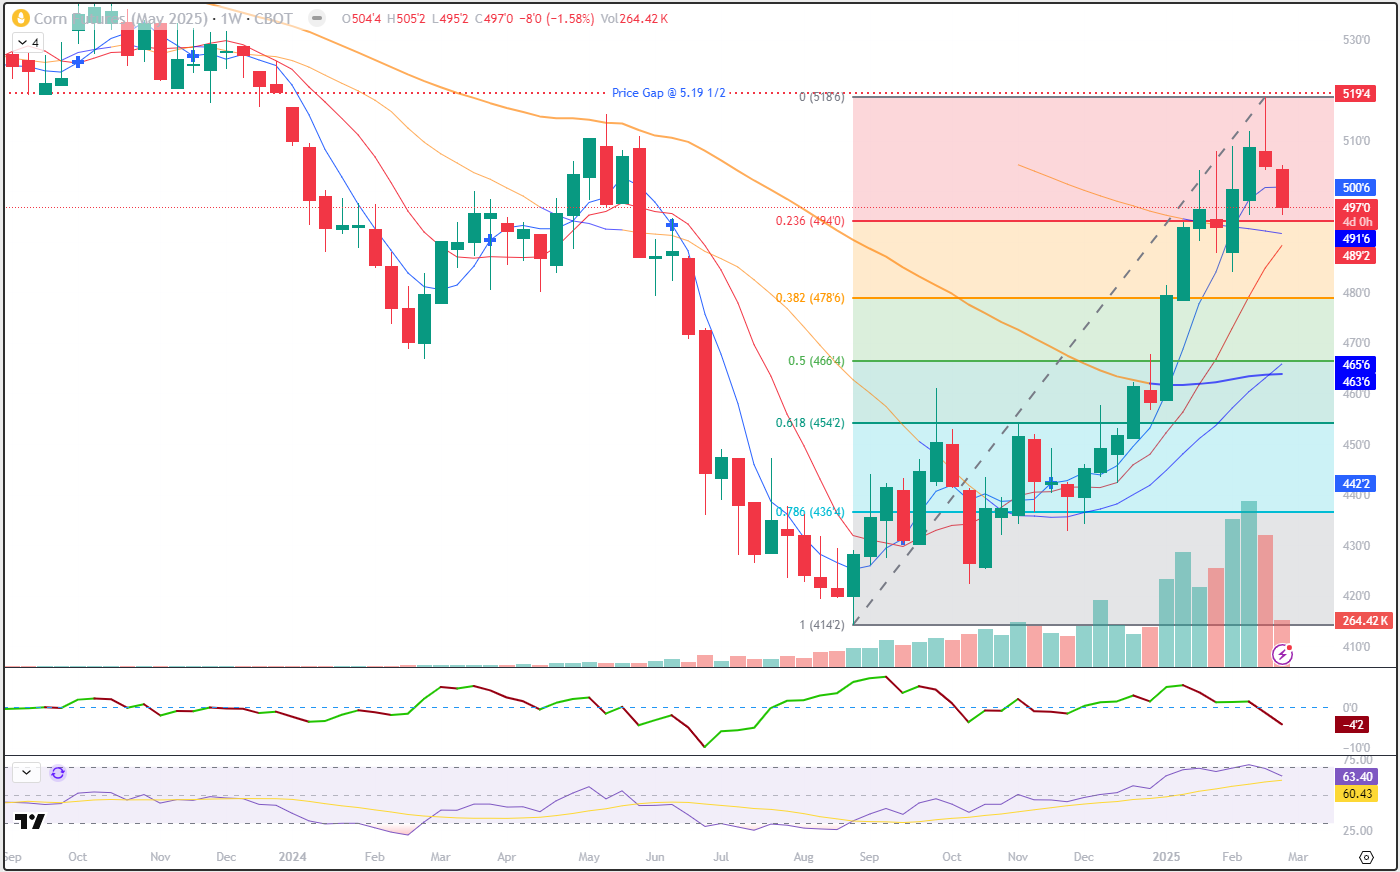
The weekly chart shows me a few things right off the bat. First off, last week the Corn market was unable to fill that gap at 5.19. Since then, price have dropped over 20 cents. This week’s low (so far) is 4.95 ¼ matching the low from 2 weeks ago. That number may offer a support level if the Corn Bulls rush back in. With the exception of the 5-Week average (blue, 5.00 ¾) all of the remaining averages on the chart are below the market, offering support levels. The 200-week (shortest, was orange now blue) is near 4.91 ¾ and the 10-week (red) is at 4.89 ¼ today. It’s also supportive that the 50- and 100-week averages made bullish crossover last week. Those are both blue, at 4.65 ¾ and 4.63 ¾, respectively. I think that crossover would be a bit more bullish if prices can resume the uptrend soon, but it’s still a bullish sign. The only Fibonacci retracements that I see coming into play are the 23% and 38% levels, near 4.94 and 4.78 ¾. Those are shown in the shaded areas above. There are additional levels lower, but if May Corn were to hit 4.66 ½ (50%) this week, I’d have to say we’re likely going lower. As the trend has been up since the middle of November, aggressive and well-margined traders may do well to consider establishing long positions, risking a close below that 10-week average at 4.89 ¼.
May Corn (Seasonal)
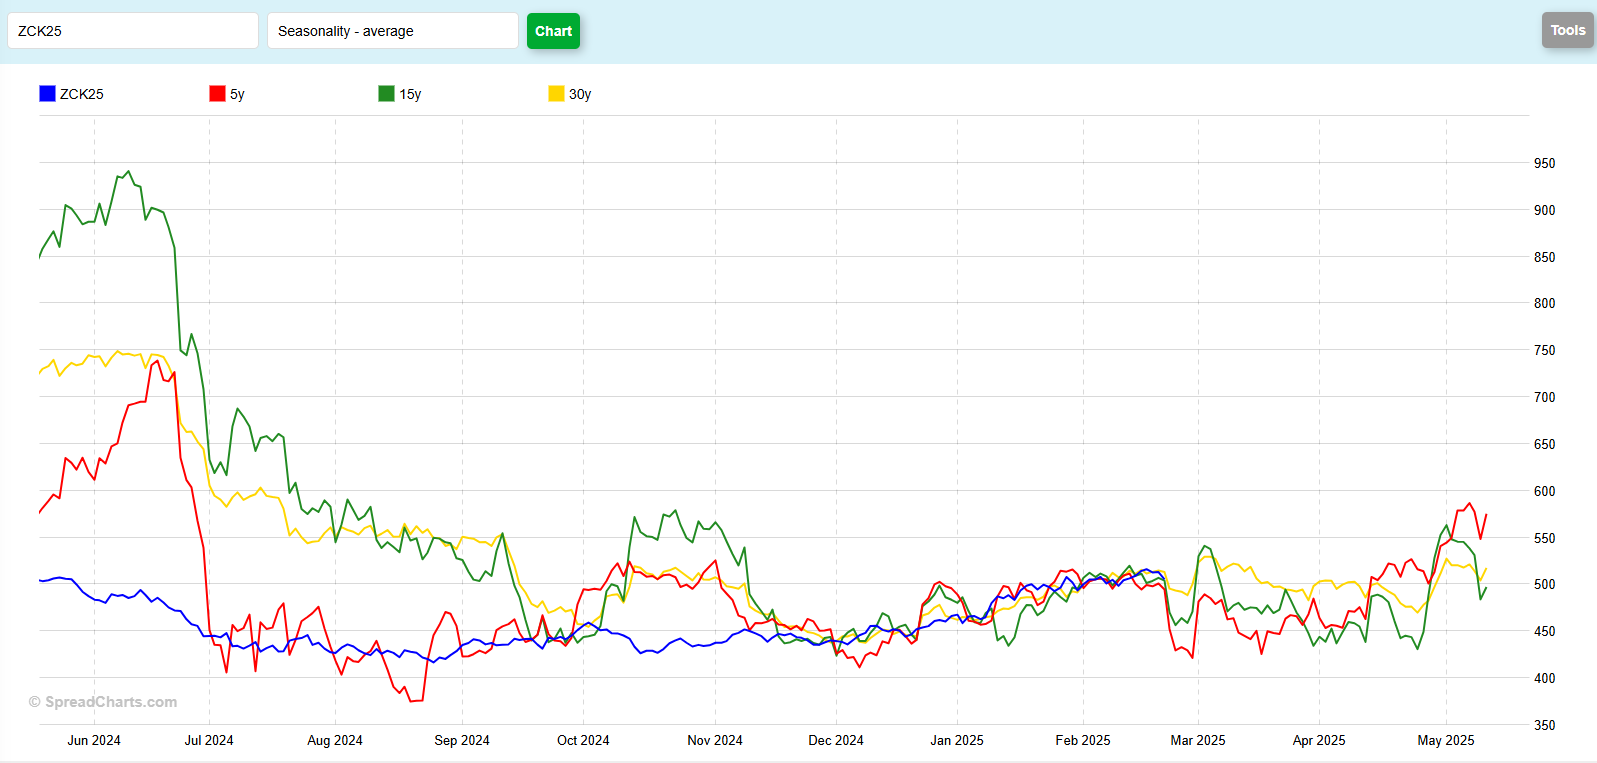
The seasonal chart is not offering a lot of clues to direction, in my opinion. To my eye, this last week in February is typically weaker. I think this is due to contract rollover, as First Notice Day for the March contracts is this coming Friday (28th) and the March Corn options all expired last Friday (21st) Once rollover is complete, prices seem to bounce a little into the first few days of March. After that, it’s a little less clear. The 30-year pattern (yellow) is for prices to peak early in March (5.30-ish Is where the peak is valued) and then stay weak until the May options get ready to expire April 25th. That low on the 30-year is about 4.70. The 15-year pattern (green) suggests a similar pattern, peaking near 5.40, before declining to about 4.30 late in April. There are some bumps along the way, you may notice from the chart, but on balance, the 15- and 30-year patterns suggest weakness. The 5-year (red) seems to do the opposite. It peaks early in March near 4.88, declines to 4.24 in the middle of March and the rallies to north of 5.00 by option expiry. To recap what I see, the 30 and 15 year patterns suggest steady price weakness from March and April, while the 5 yar pattern does the opposite for most of that time frame. Do you see anything interesting unfolding from the seasonal chart here?
Jefferson Fosse Walsh Trading
Direct 312 957 8248 Toll Free 800 556 9411
jfosse@walshtrading.com www.walshtrading.com
Walsh Trading, Inc. is registered as a Guaranteed Introducing Broker with the Commodity Futures Trading Commission and an NFA Member.
Futures and options trading involves substantial risk and is not suitable for all investors. Therefore, individuals should carefully consider their financial condition in deciding whether to trade. Option traders should be aware that the exercise of a long option will result in a futures position. The valuation of futures and options may fluctuate, and as a result, clients may lose more than their original investment. The information contained on this site is the opinion of the writer or was obtained from sources cited within the commentary. The impact on market prices due to seasonal or market cycles and current news events may already be reflected in market prices. PAST PERFORMANCE IS NOT NECESSARILY INDICATIVE OF FUTURE RESULTS. All information, communications, publications, and reports, including this specific material, used and distributed by Walsh Trading, Inc. (“WTI”) shall be construed as a solicitation for entering into a derivatives transaction. WTI does not distribute research reports, employ research analysts, or maintain a research department as defined in CFTC Regulation 1.71.