
The information and opinions expressed below are based on my analysis of price behavior and chart activity
April Live Cattle (Daily)
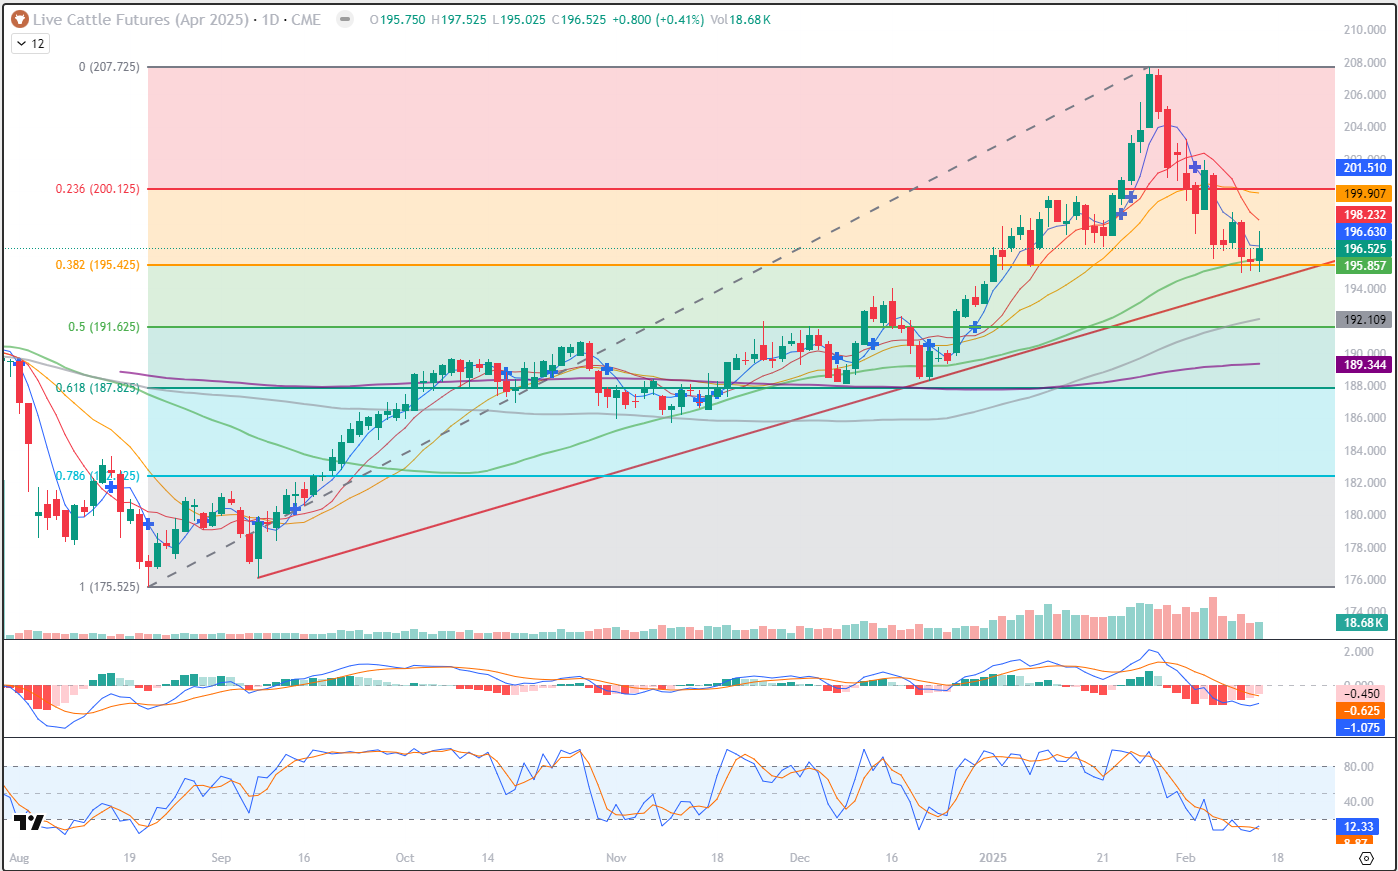
Today, April Live Cattle closed at 196.525, up .800 on the day. Yesterday’s trade posted a bit of an equilibrium day, to my eye. Not quite a textbook Doji, as there was .100 difference between the open and close. Yesterday awas also the lowest trading volume for the week, so far, lending credence to the thought that downward momentum has slowed. We’ve also seen very similar lows for the past three sessions, as 195.000 has been good support this week. The 50-day average (green) is currently at 195.857 which as has been tested and supported so far this week. We have not yet seen a close below that average, but Wednesday’s close was right on the average. There is also trendline support that I’ve drawn off of the Sept 9th and Dec 20th lows. Today that trendline value is at 194.450. If we see a close below that, I think prices will accelerate lower, as the last commitment of traders report still showed a very large imbalance to the long side and weakness may result in “fund liquidation.” However, the coincidental convergence of the 38% Fibonacci retracement, the 50-day average and that trendline approaching may give those funds reason to defend their positions and buy more. Stochastics (bottom sub-graph) are very overbought and did make a very slight turn up today. The MACD just above that also show signs of slowing the downside pace, at least over the past few days. There might be a bullish reversal tomorrow, because it’s Friday ahead of a long weekend and also because downside momentum appears to be waning. Overhead resistance might be found at 196.630 (5-day average), 198.232 (10-day) which is not too far from Monday’s high of 198.700. Support levels could be the 50-day average at 195.857, the 38% Fibonacci retracement at 195.425 and that trendline at 194.450, roughly. The 50-day is still inclined higher, as are the 100-day (192.109) and the 200-day (189.344) averages.
April Live Cattle (Weekly)
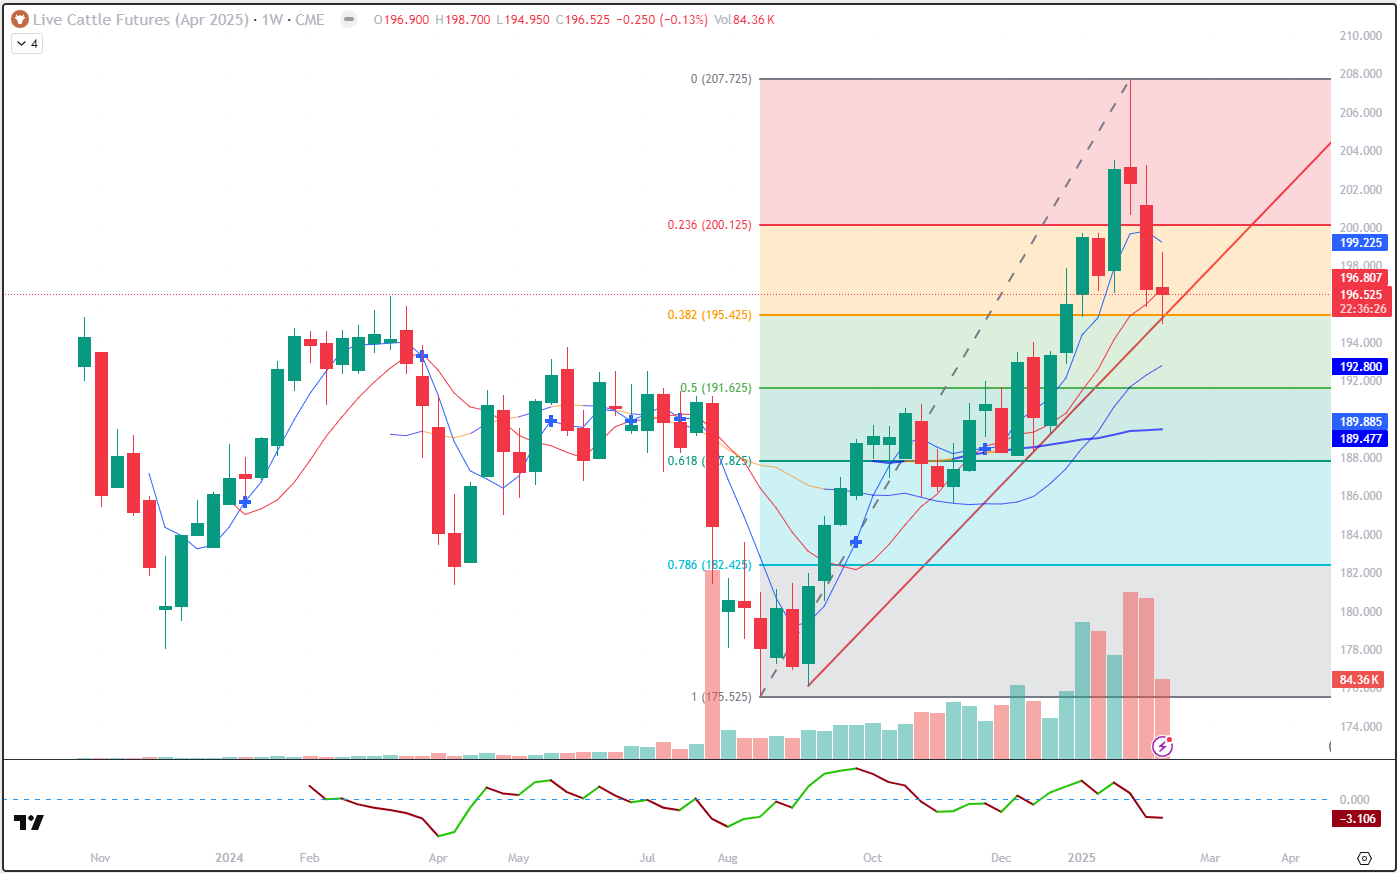
The weekly chart tells me that the April Cattle have retraced about 38% from the August lows to the January highs. That might be a point of technical support, near the 195.425 level. Volume so far this week, after 4 out of 5 days, is at 84,000 contracts. That is less than half of the volume of the past 2 weeks, and is currently on pace to be the lowest volume of the year, so far. That tells me the selling pressure is drying up a bit, which may give way to a resumption of the uptrend. You’ll notice that the market tested and bounced off of the red trendline support, which is drawn off the lows of September and the low from the middle of Dec. That trendline also seems to coincide with the 38% retracement. Weekly support might be found near that retracement at 195.425, the 20-week average near 192.800 or the 50% retracement at 191.625. Resistance might be found near 5 week average which is above the market at 199.225, which still a bit shy of the nice, even, round number of 200.000.
April Live Cattle (Seasonal)
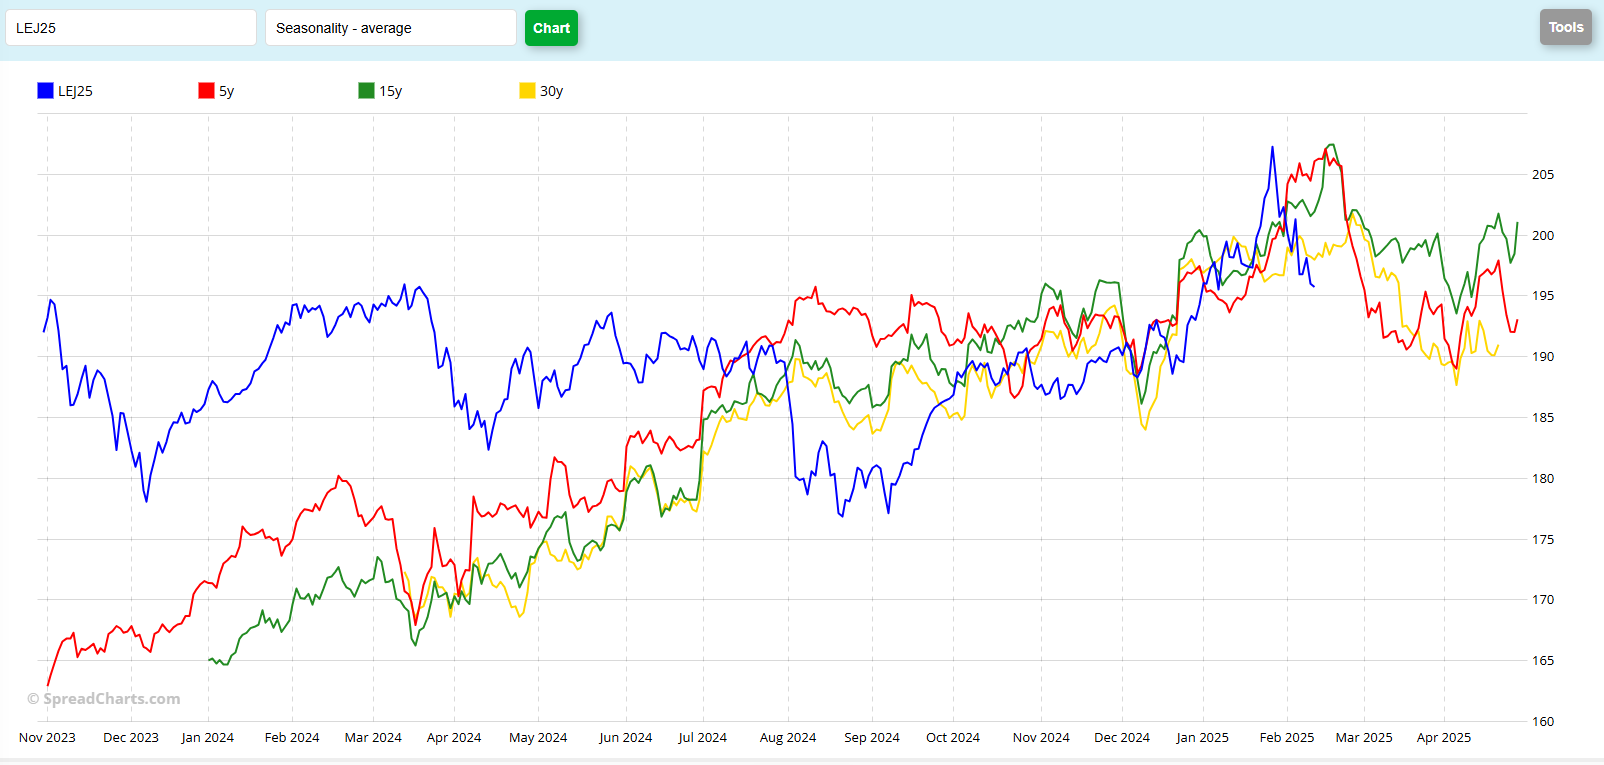
To my eye, this seasonal chart shows the market out of sync with the typical historical patterns until about August-September of last year. Since then, it does seem to have re-aligned somewhat. Not exactly, perhaps, though. While the pattern alignment has gotten a little better, the peaks and valleys are not exactly lined up. Looking forward, the historical patterns suggest a top occurring next week. But I think you might notice that the current contract (blue) made it’s peak on Jan 28th, about 3 weeks earlier than the historicals. Those 5, 15 and 30 year patterns also show weakness until about the first week of April. What do you think this shows?
Jefferson Fosse Walsh Trading
Direct 312 957 8248 Toll Free 800 556 9411
jfosse@walshtrading.com www.walshtrading.com
Walsh Trading, Inc. is registered as a Guaranteed Introducing Broker with the Commodity Futures Trading Commission and an NFA Member.
Futures and options trading involves substantial risk and is not suitable for all investors. Therefore, individuals should carefully consider their financial condition in deciding whether to trade. Option traders should be aware that the exercise of a long option will result in a futures position. The valuation of futures and options may fluctuate, and as a result, clients may lose more than their original investment. The information contained on this site is the opinion of the writer or was obtained from sources cited within the commentary. The impact on market prices due to seasonal or market cycles and current news events may already be reflected in market prices. PAST PERFORMANCE IS NOT NECESSARILY INDICATIVE OF FUTURE RESULTS. All information, communications, publications, and reports, including this specific material, used and distributed by Walsh Trading, Inc. (“WTI”) shall be construed as a solicitation for entering into a derivatives transaction. WTI does not distribute research reports, employ research analysts, or maintain a research department as defined in CFTC Regulation 1.71.