
The information and opinions expressed below are based on my analysis of price behavior and chart activity
December Corn (Daily)
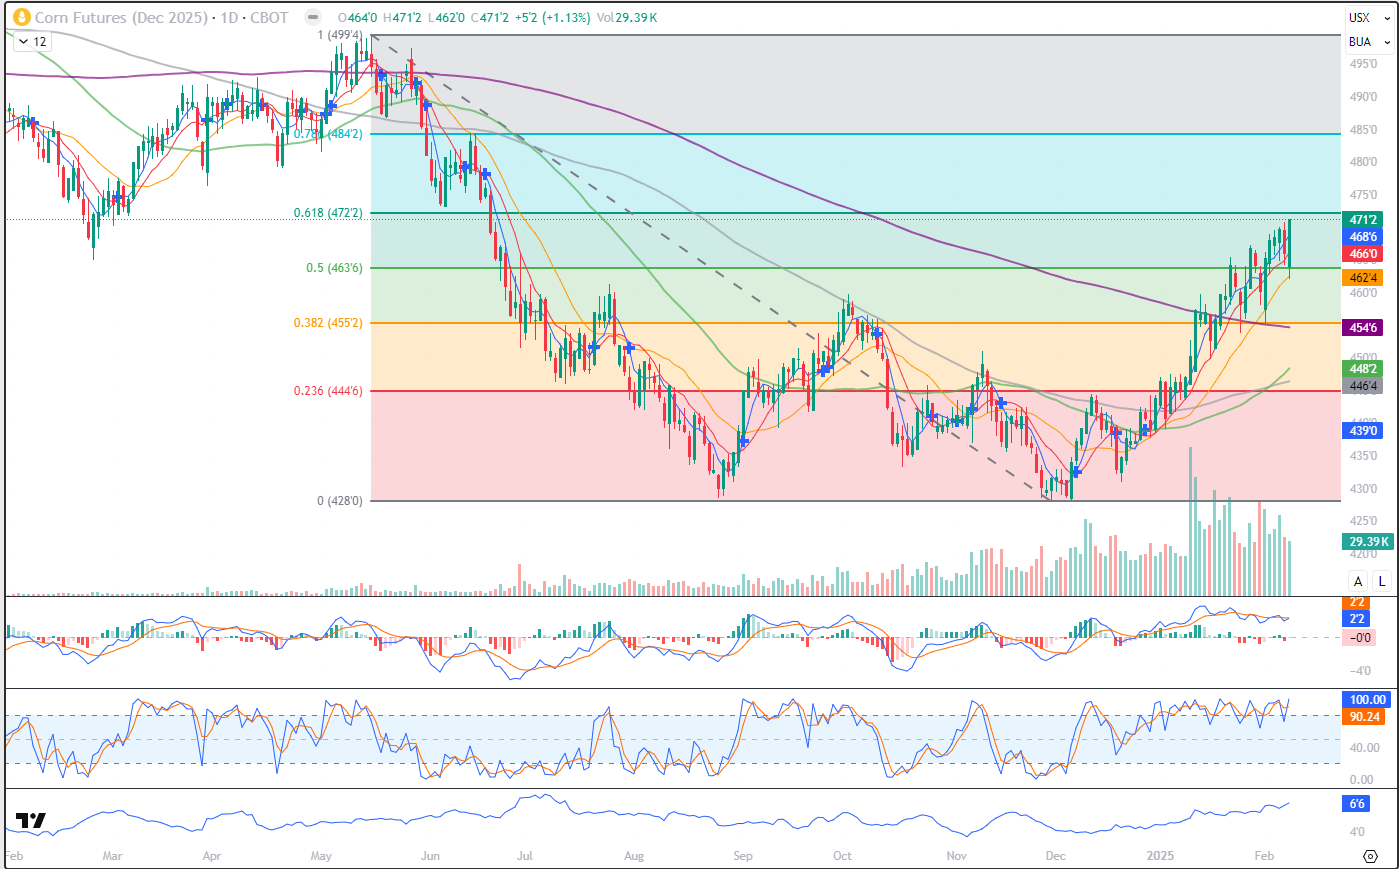
December Corn closed at 4.71 ¼ today, up 5 ¼ cents on the day. After opening last night below Friday’s low, prices rallied throughout the session, closing above Friday’s high, posting a Bullish Engulfment on the chart. Monday’s close was also the highest close since June 18th, 2024, in the December contract. Stochastics (middle sub-graph) are a bit overbought, but they’ve been that way since the end of December. I’ve added a moving average to this chart, as well. Since this is February, the month that Crop Insurance prices are set, I’ve added the 19 day moving average (orange) Why 19 days? Because that’s how many trading days there are in Feb and the reading on the 28th should give us the insurance price. Today, that value is at 4.62 ½, and has been rising. Also, coincidentally, that is very close to today’s low (4.62) This contract has been in a reasonably strong uptrend since the double-bottom in December and is not really showing any signs of slowing, that I can see. I’ve included the Fibonacci retracement on the chart, going from last May’s highs to December’s lows. Those are denoted by the shaded areas on the chart. We’re currently trading above the 50% level (4.63 ¾) with the 62% level just above the market at 4.72 ¼. The 78% retracement, at 4.84 ¼, would be the further upside Fibonacci target. Producers should consider hedging 25% of their intended production at these current levels. Aggressive and well-margined hedgers may do well consider short positions in December futures. Producers that are less aggressive, may do well to consider Put options, such as December 450’s (28 1/8, or $1,662.50 plus commissions and fees) If that’s too rich for your account, consider selling 400 puts against the 450’s to bring in 9 ¼, or $462.50 less commissions and fees, reducing your out-of-pocket expense. If the options appeal to you, I would also recommend selling the December 500 Call with that put spread. Today, the 3-way option spread (Buying a Dec 450 Put, Selling a Dec 400 Put and Selling a December 500 Call) can be done for a credit of 7 3/8, or $368.75 coming into your account, before commissions and fees. That 500 Call closed at 29 3/8 today. To my eye, as a hedge, selling that call puts you effectively (and temporarily) short Dec Corn at 5.29 3/8. If the market goes down, the sold call should lose value and the put spread should increase. If prices go up, that Call will increase in value, perhaps offering some margin pain, depending on your funding levels. Your overall risk is a close above 5.29 3/8, at today’s settlement prices, but I have yet to speak with a single US farmer so far this year that wouldn’t sell New Crop Corn for 5.29+ Aggressive and well-margined futures traders may do well to consider long futures positions, given today’s Bullish Engulfment. Support may appear near the 5- and 10-day moving averages, 468 ¾ and 466, respectively. Resistance may show up in the form of the 62% retracement, at 472 ¼, the early June low of 473 ¼ and the 475 mark (nice big round even number, so to speak) While I’m bullish, I do think that 500 is a heavy lift from here. At this time, I don’t see anything that would warrant a push to 500, but tomorrow’s WASDE may show otherwise.
December Corn (Weekly)
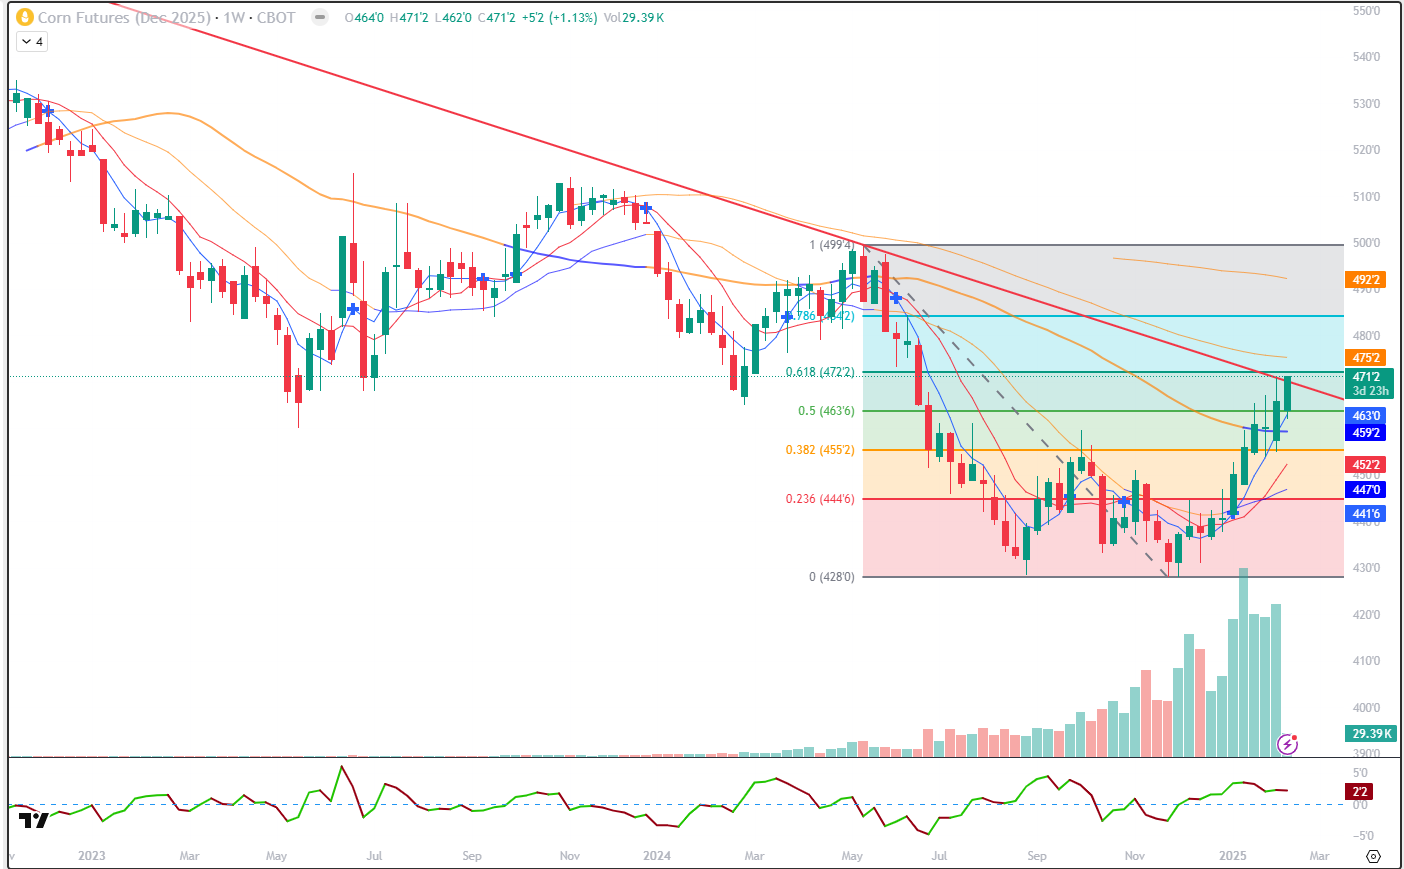
The weekly Dec Corn chart appears strong, to my eye. The market has been trending up since December’s “Tweezer” bottom and has good momentum. It’s only Monday, but today’s close would be the highest weekly close since the second week of June 2024. The 5-week moving average is at 463 (blue) today and the 10-week is at 452 ¼(red). Located between those two is the 100-week moving average at 459 ¼. That is denoted by the line that changed from orange to blue over the past 4 weeks. You’ll notice that the colors changed with that average for a week last April and before that, for 13 weeks in Oct-Dec of 2023. You can see also, that the Fibonacci retracements only cover the past year highs/lows. If I go back further and cover the 2022 or 2023 highs, the current numbers become invalid. There is also a red downtrend line drawn off of the April 2022-May 2024 highs. Today’s close just cleared that. Again it’s Monday and early in the week, but if Dec can hold above that this week, I think it would be a supportive sign.
December Corn (Seasonal)
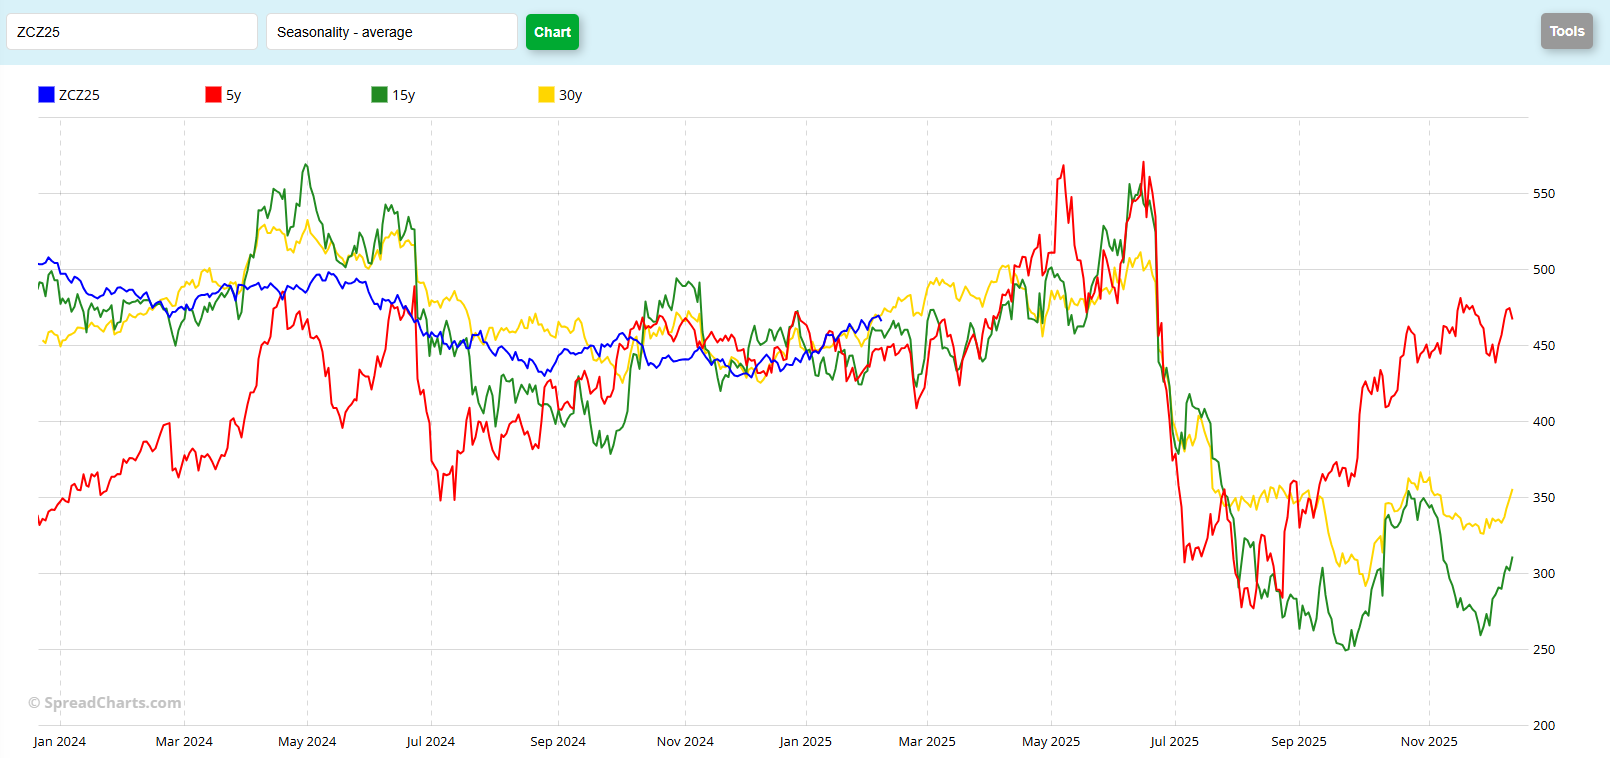
My seasonal chart tells me a few things: First off, while certainly not an exact match, December Corn has held to its historical seasonal patterns better than most markets. The peaks and valleys don’t match up, as far as price levels go, but to my eye, the overall patterns do. We’ve been making highs when we’re “supposed to” in the late-April to early-May time frame, along with making lows in the “normal” period of mid-November. Again, it is not exact, but I do think it’s “close enough” so to speak. Moving forward, the 30-year (yellow) pattern suggests a peak in early-April, with another re-test of those highs just before Father’s Day. The 15-year (green) pattern suggests a choppy, but higher, trend until just before Father’s Day. The 5 -Year pattern (red) is much more volatile, suggesting a peak in early-May, before prices fall off of a cliff after Father’s Day. My thought is that this year’s market will hold fairly closely to the 30-year pattern. Prices are relatively low (think inflation adjustments), producers are struggling with profit margins and there is a lot of unknown with the new administration in Washington. Of course, an outside influence could change a lot. Will tariffs remain permanent? Will they be increased or reduced? Will China be persuaded to honor their “Phase One” purchasing commitments from Trump’s first term? Will weather this spring be conducive to planting here in the US? Or will some other thing come along and make us forget about all of those?
Jefferson Fosse Walsh Trading
Direct 312 957 8248 Toll Free 800 556 9411
jfosse@walshtrading.com www.walshtrading.com
Walsh Trading, Inc. is registered as a Guaranteed Introducing Broker with the Commodity Futures Trading Commission and an NFA Member.
Futures and options trading involves substantial risk and is not suitable for all investors. Therefore, individuals should carefully consider their financial condition in deciding whether to trade. Option traders should be aware that the exercise of a long option will result in a futures position. The valuation of futures and options may fluctuate, and as a result, clients may lose more than their original investment. The information contained on this site is the opinion of the writer or was obtained from sources cited within the commentary. The impact on market prices due to seasonal or market cycles and current news events may already be reflected in market prices. PAST PERFORMANCE IS NOT NECESSARILY INDICATIVE OF FUTURE RESULTS. All information, communications, publications, and reports, including this specific material, used and distributed by Walsh Trading, Inc. (“WTI”) shall be construed as a solicitation for entering into a derivatives transaction. WTI does not distribute research reports, employ research analysts, or maintain a research department as defined in CFTC Regulation 1.71.