
The information and opinions expressed below are based on my analysis of price behavior and chart activity
March Soybeans (Daily)
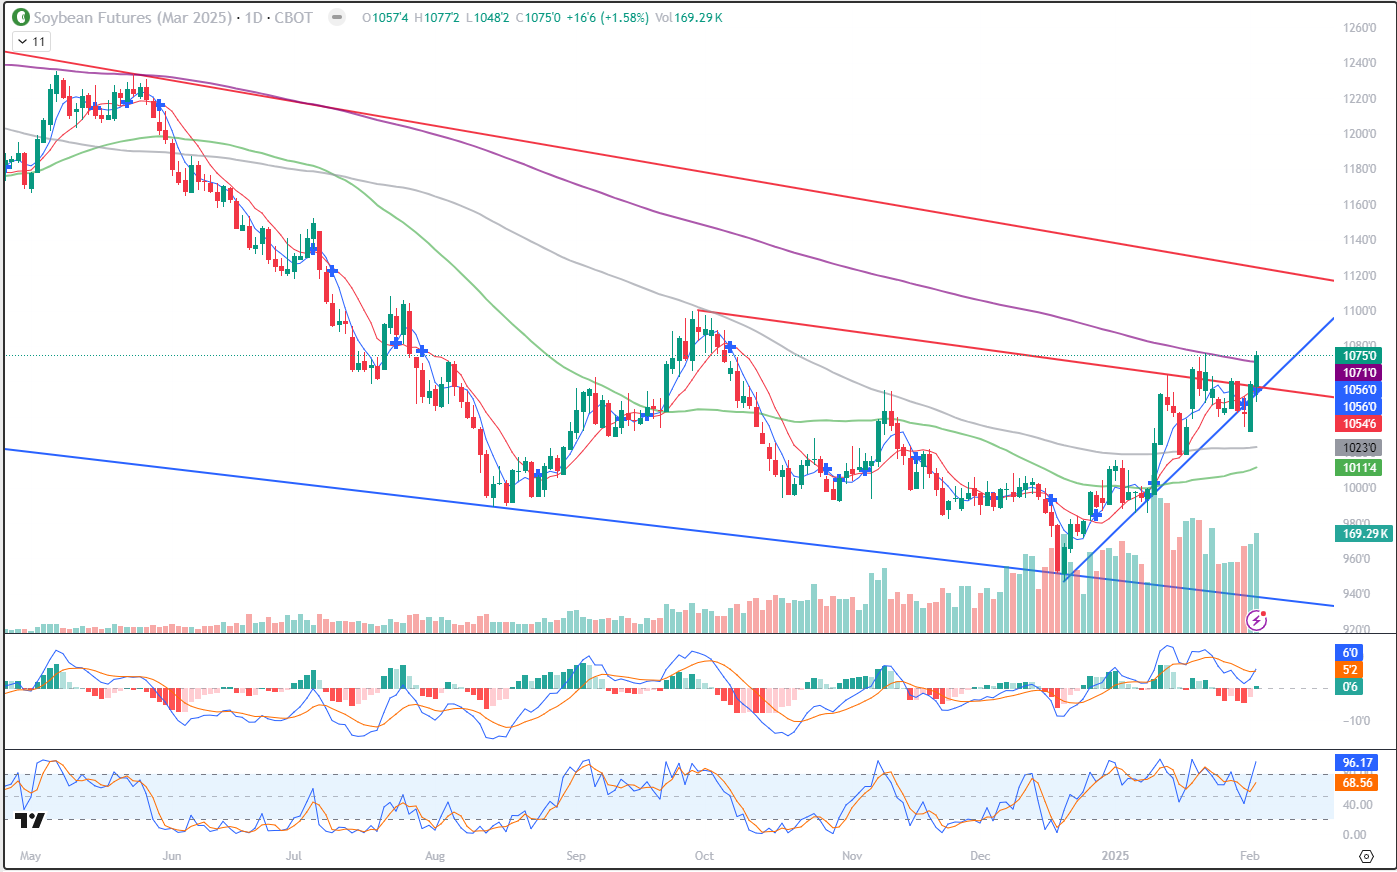
Today, March Soybeans closed at 10.75, up 16 ¾. That’s the best close since October 3rd. The threat of tariffs have caused a bit of whiplash over the past few days, causing a 16 ½ cents selloff last Thursday. Friday only saw a 2 cent decline, but it posted a Doji on the candlestick chart, indicating a point of price indecision. Monday’s market saw a lower open than Friday’s low, and the week began with a bearish tone. However, both Mexico and Canada agreed to some of changes needed or demanded on Monday, delaying those tariffs for a month. Tariffs on China were not as large as initially thought, also offering some bullish news. My 5- and 10-day moving averages have been whipsawed over the past several days, flipping to bearish territory on Friday. Monday saw a very large bullish engulfment by the end of the session and my charts flipped back to the bullish side this morning. Those are denoted by the small blue crosses on the chart above. March Beans closed above the 200-day moving average (purple) today, and that may offer some support at the 10.71 level. Beans also cleared trendline resistance again today, as you can see by the close above the red trendline. The upper one is still in place, and today that’s at roughly 11.25 today. The blue support trendline is still offering support, just above the 10.50 level. The September high of 11.00 ¼, appears to be the next reasonable upside target to me. Aggressive and well-margined traders may do well to consider long positions from here. Market risk should likely be managed with Put Options, as the daily trading ranges have gotten larger. Producers should be looking for some satisfactory price levels to clear out the bins, perhaps re-owning the sold Beans by using call options. March options only have 17 days until expiration, but I think they offer the best value (read as: cheapest) for re-owning Soybeans. May options would likely work, as well, but are much more expensive due to the time value. I don’t know if all of the tariff happiness is over with. Your guess is as good as mine. We very well could see more whipsawing if somebody balks again. The chart looks bullish to my eye. Both Stochastics and the MACD are hooking up, as well. Our time for peak demand has passed, but there is still a window for our prices to rally before the South American harvest really ramps up and traders should take advantage of that opportunity.
March Soybeans (Weekly)
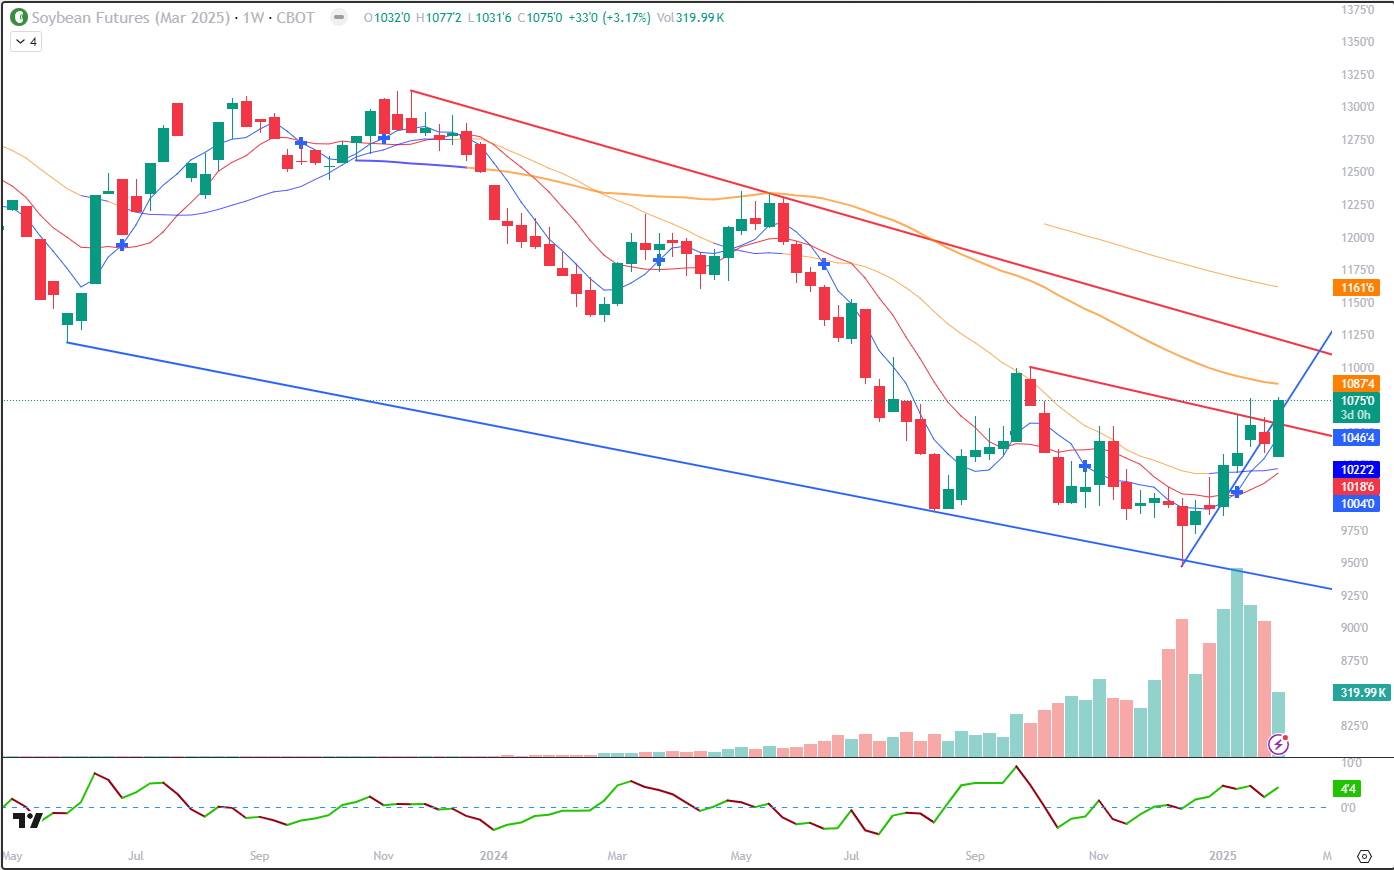
My weekly chart of has a few interesting things on it, in my opinion. First, this week’s trade is showing signs of a bullish engulfment. The market opened trade lower than last week’s open and is currently trading higher than last week’s close. If the Bean market can hold (or increase) the gains this week, I think that’s a strong technical signal. But it’s only Tuesday and a lot can happen over the next three sessions. (Does anybody else have tariff whiplash?) Secondly, if you count back 4 weeks (bars) you might notice the small blue cross on that bar. That denotes the 5- and 10-week moving averages changing trend and shifting to the bullish side. Those moving averages are offering support at 10.46 ½ and 10.18 ¾, respectively. (blue and red) The 20-week average is offering a potential support level at 10.22 ¼ today. That one changes color on my chart, it was orange when the market was trending down, but changed to blue when prices got above the average and the market began trending higher. Resistance levels on my weekly chart might be found near 10.87 ¼, which is the 50-week average, the downtrending red trendline is near 11.21 or so today and the 150-week average is up near 11.61 ¾.
March Soybeans (Seasonal)
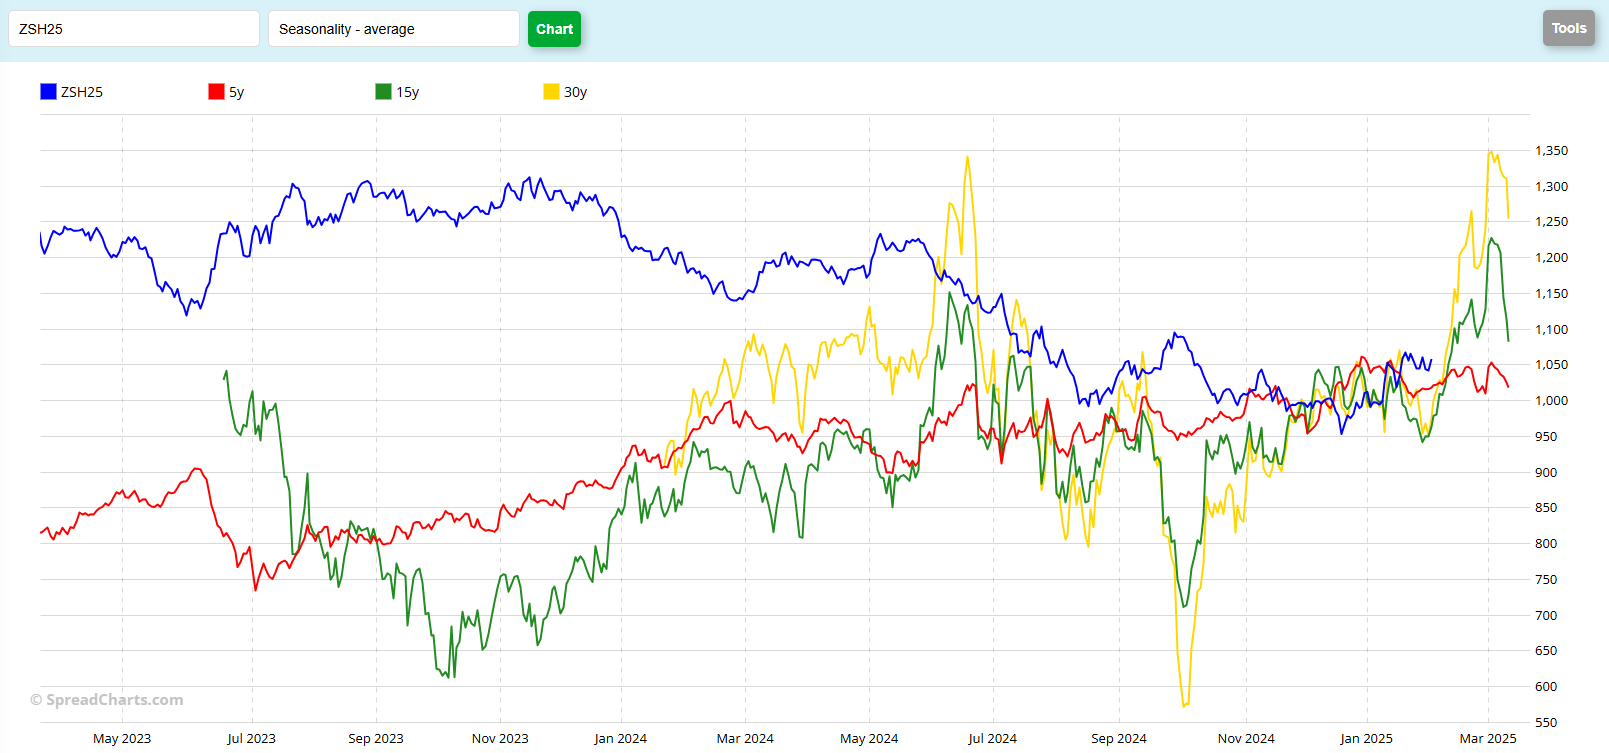
The seasonal chart suggests to me that higher prices could be on the horizon. Both the 15 (green) and 30 year (yellow) patterns indicate potential rallies of $1.64 and $2.65, respectively, during the month of February. Those data are taken from the Feb 3rd – Feb 28th measurements on the chart above. The 5 year pattern (red), measured over the same interval, suggests the opposite, indicating a potential drop of 49 cents. The 5 year data has been skewed a bit, mostly, I think by a large drop in Feb of 2024. That year saw March Beans drop 94 cents in February, following a 47 ½ cent drop in 2023. In 2022 Beans gained over $1.53 in February, over 35 cents in 2021 and 11 cents in 2020. An argument can be made that the seasonals in Soybeans have been “out of sync” with the markets, as there are relatively few points on the chart above where the current price activity (blue) matches up with the historical data. I wouldn’t expect prices to be the same, as things change from year to year, but I would expect the patterns to be similar. And for now, that’s not what I see in Soybeans. What do you notice from the seasonal chart?
Jefferson Fosse Walsh Trading
Direct 312 957 8248 Toll Free 800 556 9411
jfosse@walshtrading.com www.walshtrading.com
Walsh Trading, Inc. is registered as a Guaranteed Introducing Broker with the Commodity Futures Trading Commission and an NFA Member.
Futures and options trading involves substantial risk and is not suitable for all investors. Therefore, individuals should carefully consider their financial condition in deciding whether to trade. Option traders should be aware that the exercise of a long option will result in a futures position. The valuation of futures and options may fluctuate, and as a result, clients may lose more than their original investment. The information contained on this site is the opinion of the writer or was obtained from sources cited within the commentary. The impact on market prices due to seasonal or market cycles and current news events may already be reflected in market prices. PAST PERFORMANCE IS NOT NECESSARILY INDICATIVE OF FUTURE RESULTS. All information, communications, publications, and reports, including this specific material, used and distributed by Walsh Trading, Inc. (“WTI”) shall be construed as a solicitation for entering into a derivatives transaction. WTI does not distribute research reports, employ research analysts, or maintain a research department as defined in CFTC Regulation 1.71.