
The information and opinions expressed below are based on my analysis of price behavior and chart activity
March Kansas City Wheat (Daily)
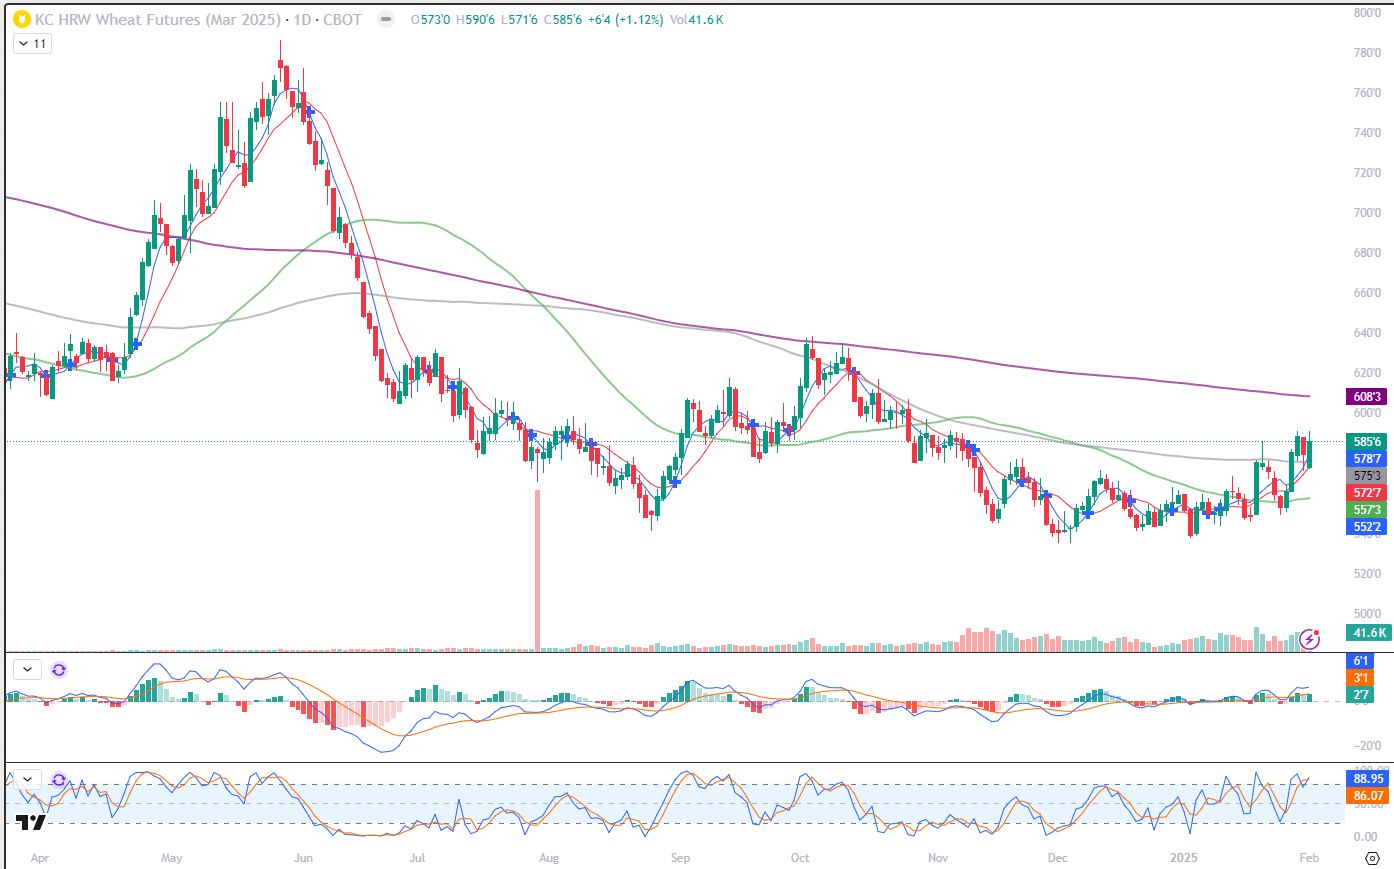
As we start “tariff week” the March KC Wheat closed up 6 ½ cents, settling at 5.85 ¾. You might notice that 4 of the past 4 sessions saw the market close above the 100-day moving average (grey line), currently at 5.75 3/8. This market hasn’t done that since last April-June time frame. That 100-day average was tested in early October, with 4 closes above that average. They were not consecutive sessions, and ultimately the market faded lower, away from that average. The new year has brought a new potential trend. A large move higher on January 21st started the move, with the market closing at 2 ½ month highs, roughly, and just shy of that 100-day average. Some pressure emerged, pushing the market lower for 4 days. Support emerged again and last Wednesday’s close at 5.80 ¼ was the first close above the 100-day since October 10th. You might notice that the 5-and 10-day moving averages crossed over to the bullish side on January 10th. That might be tough to see, but those crossovers are denoted by the blue crosses (or “plus” signs) Both the 5- and 10-day moving averages are currently below the market at 5.78 7/8 and 5.72 7/8, respectively. Those potential support numbers are on either side of the 100-day average, which is at 5.75 3/8. Stochastics are just entering overbought territory over the past week or so, but that doesn’t tell us much at this point, other than the bullish momentum is still strong. MACD (just above the Stochastic, in the first sub-graph) is at the highest it’s been since early October, when the market was heading up toward the 100- and 200 day moving averages. There will likely be some resistance near the 200-day average, at 6.08 3/8 today, and probably the nice fat, round number of 6.00. Technically speaking, to my eye, this chart looks bullish. Add in the drought conditions currently being experienced across the high plains, along with parts of OK and TX, and I think we could see some higher prices. We’ll know more in the coming weeks, and of course the weather could change, but cold winter temps with no, or little, snow cover on the current KC crop is setting our producers up for yield loss this spring. While the KC crop is a relatively small sliver of the world production, it is part of it. Any reductions in yield or quality are usually bullish for prices. Aggressive and well-margined traders may do well to consider long futures positions in KC Wheat. At this moment, I’m not wildly bullish. I don’t see anything that would warrant a repeat of last May’s rally to 7.86 ¼. But I do think it’s possible to test the 200-day moving average, which would be about a 23 cent move from today’s close. I think a test of the October high at 6.38 ¼ may also be in the cards. That’s about 50 cents from today’s close. Given the recent trading ranges, I’m of the opinion that risk on the long trade may be better managed with a Put option, or a Put strategy. I’d hate to see someone get stopped out of a futures position during one of these “tariffs on, tariffs off” whipsaws we’ve been seeing.
March Kansas City Wheat (Weekly)
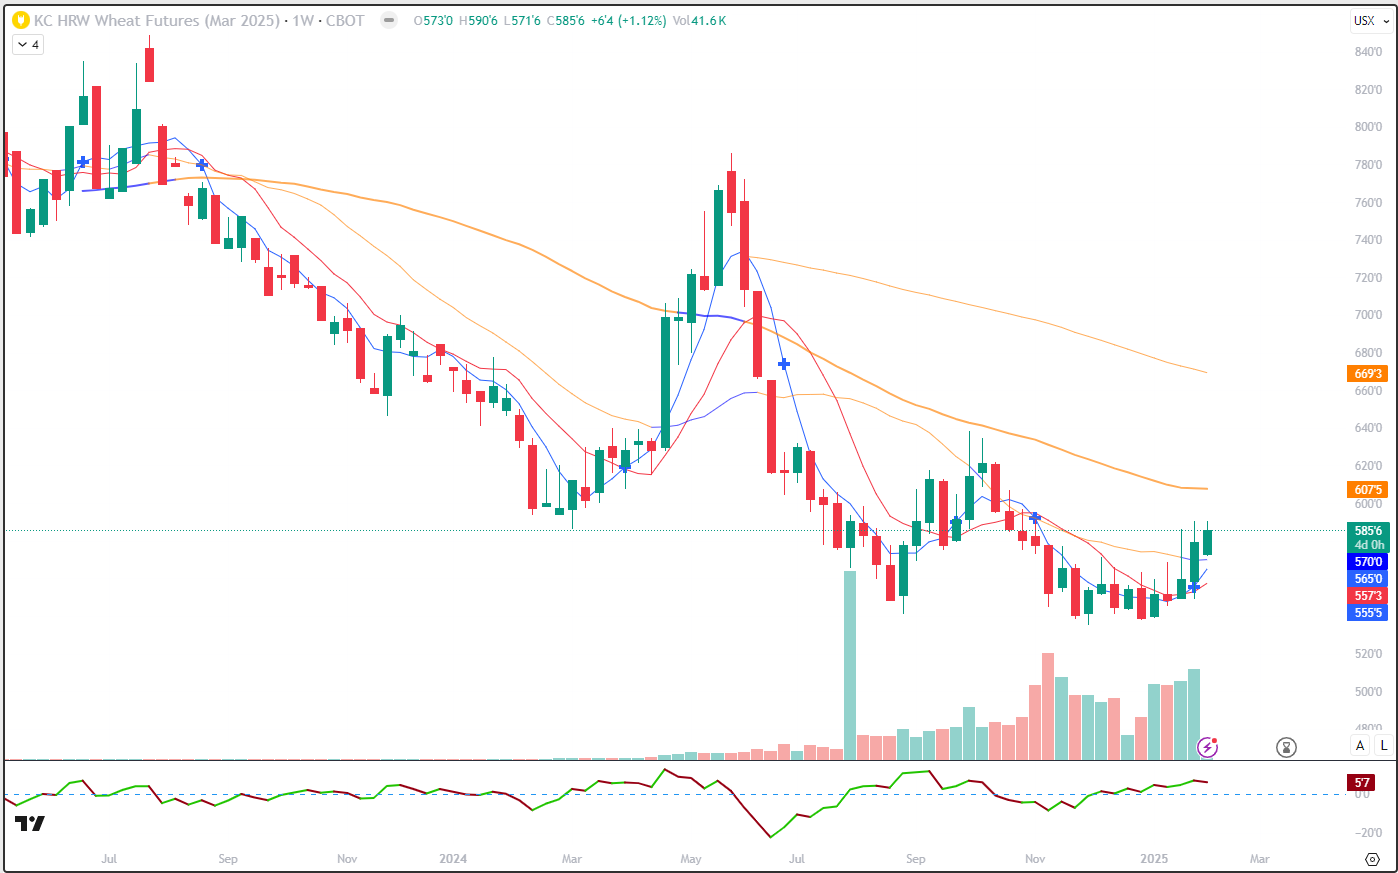
As we take a look at the weekly chart, you might notice that the 5- and 10-week moving averages crossed into bullish territory with last week’s trade. (Chicago Wheat hasn’t quite made these turns yet, but it’s not far behind) Again, that’s denoted by the small blue cross in last week’s bar. At this point, both the weekly and daily are giving the same type of signal, which I think adds to the bullishness. Weekly support might be found near that 5-week average, near 5.65, or the 10-week average, near 5.57 ¾. The 20-week average is a bit closer to the market, near the 5.70 mark. Resistance targets could be the 50-week average, 6.07 5/8 or way up at 6.69 3/8, where the 100-week average is located today. This is a market that has been trending lower, for the past (almost) 2 years. Traders or producers that are not that aggressive, may do well to consider Call options in KC Wheat. March Calls expire in 18 days. While certainly NOT a long-term solution or trade, those will give you the least amount of price risk or cost, while allowing you to participate in upside over the next couple of weeks. I would suggest that if you agree my point of view, but are unwilling to jump into the futures. For example, a 610 March KC Wheat call closed at 7 7/8, or $393.75, plus commissions and fees.
March Kansas City Wheat (Seasonal)
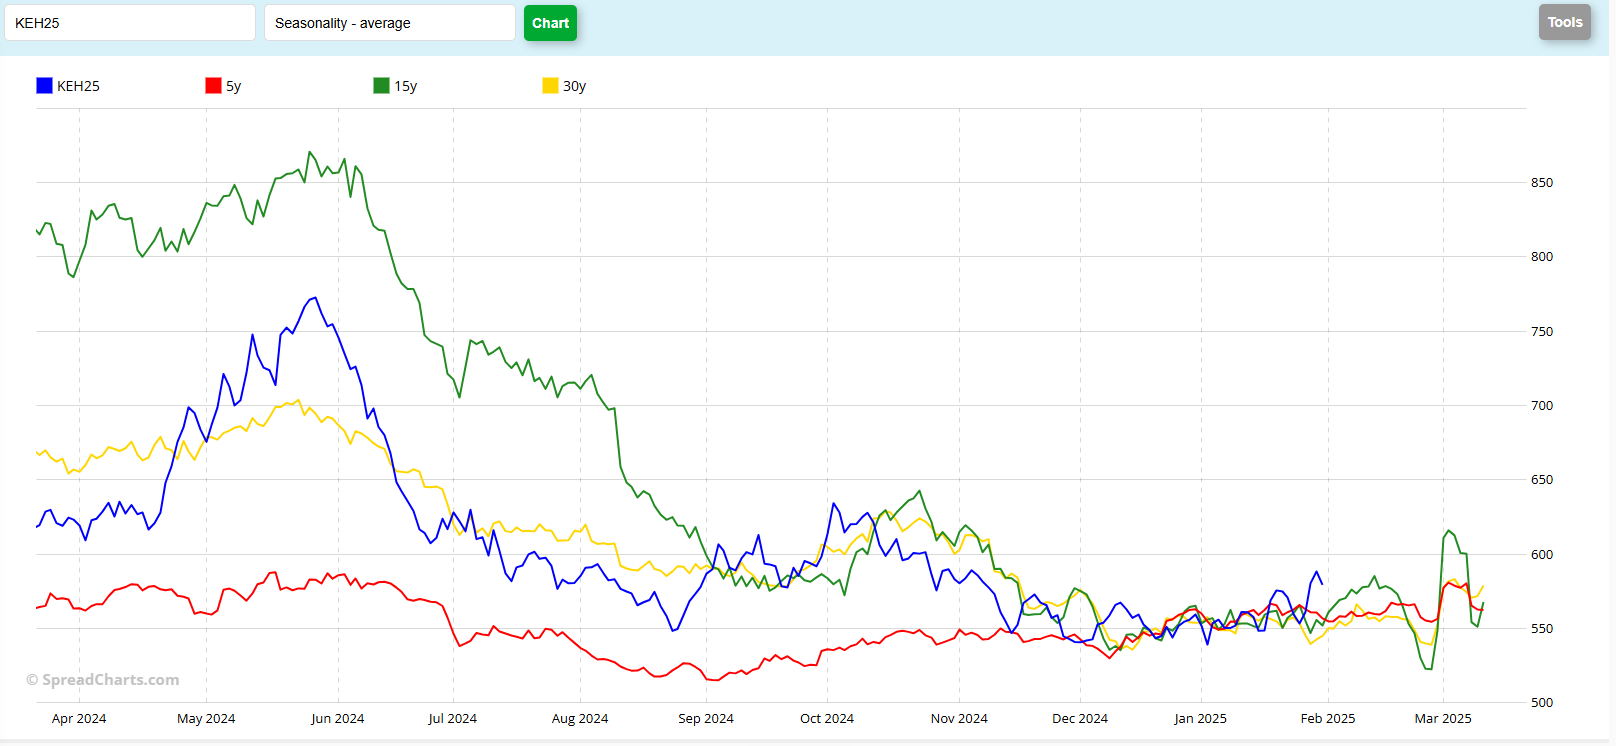
This chart indicates to me that, overall, KC Wheat has been holding to the shape of its typical seasonal patterns. To my eye, this market is one that has held to the “normal” patterns, not necessarily the prices. We saw the peak this past year in May, followed by a downtrend until August, a slight rally into October and then a period of sideways, choppy, consolidation from mid-Nov until mid-Jan. The month of February appears to be a volatile one, ahead of March’s FND. The patterns suggest higher for the first week or two, then lower to new lows, then higher again by March 1st. If I was just looking at the seasonal, I probably wouldn’t expect much movement in the month ahead, certainly not enough to generate a “seasonal” trading signal, in my opinion.
Jefferson Fosse Walsh Trading
Direct 312 957 8248 Toll Free 800 556 9411
jfosse@walshtrading.com www.walshtrading.com
Walsh Trading, Inc. is registered as a Guaranteed Introducing Broker with the Commodity Futures Trading Commission and an NFA Member.
Futures and options trading involves substantial risk and is not suitable for all investors. Therefore, individuals should carefully consider their financial condition in deciding whether to trade. Option traders should be aware that the exercise of a long option will result in a futures position. The valuation of futures and options may fluctuate, and as a result, clients may lose more than their original investment. The information contained on this site is the opinion of the writer or was obtained from sources cited within the commentary. The impact on market prices due to seasonal or market cycles and current news events may already be reflected in market prices. PAST PERFORMANCE IS NOT NECESSARILY INDICATIVE OF FUTURE RESULTS. All information, communications, publications, and reports, including this specific material, used and distributed by Walsh Trading, Inc. (“WTI”) shall be construed as a solicitation for entering into a derivatives transaction. WTI does not distribute research reports, employ research analysts, or maintain a research department as defined in CFTC Regulation 1.71.