
The information and opinions expressed below are based on my analysis of price behavior and chart activity
March Soybean Oil (Daily)
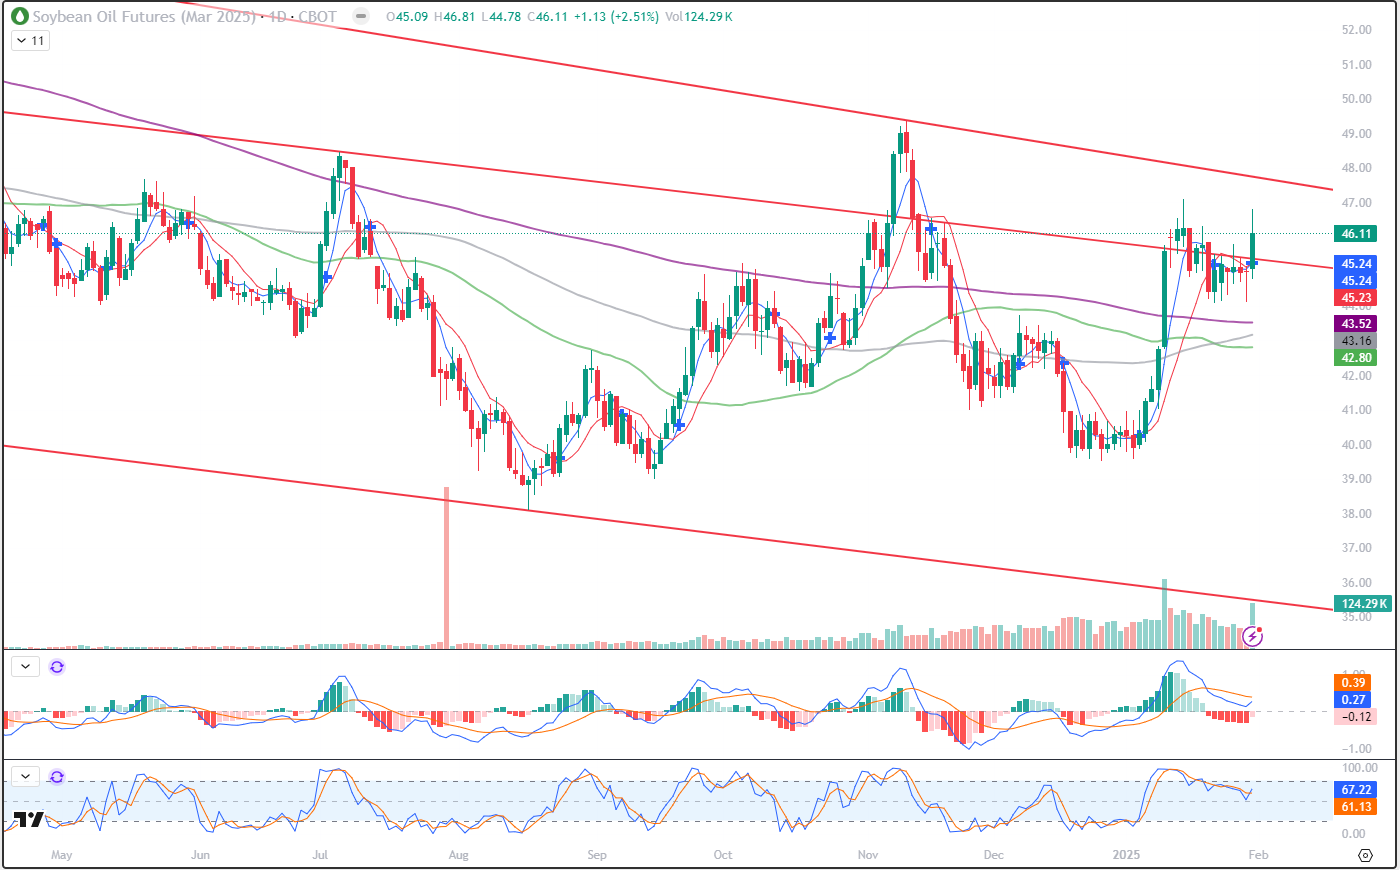
On Friday, March Soybean Oil closed up 1.13, at 46.11. Today’s bullish activity followed yesterday’s Doji, which is a day (bar) that opens and close at, or nearly at, the same price. Thursday’s trade also saw this contract set a new low for the week at 44.10, before closing at 44.98. Friday’s trade posted new highs for the week, but did settle off that high print of 46.81. Much of today’s trade activity was affected by the Trump Administration’s looming tariffs. Thursday afternoon, there was talk that the tariffs were definitely set to begin on Feb 1. That immediately had an effect on the markets that were trading at that time. Grain markets were not open then. The overnight trade pushed contracts in Corn, Soybeans, Soy Meal and Wheat lower. (Corn even gapped lower) However, Beal Oil opened higher and maintained its strength throughout the evening session. It turned weak at about 11 AM today, when a wire report from Reuters erroneously stated that tariffs were being delayed until March 1st. The report pushed Bean Oil into negative territory and an intraday low of 45.26. The White House responded by stating that report was false and that tariffs of 25% will be applied to products come from Canada and Mexico, 10% to Chinese products will begin February 1st. And the market rallied to the highest close since January 15th. As you may see from the chart, that close was above trendline resistance. The 5- and 10-day moving averages crossed into bullish territory today, as well. To my eye, the bullish close following a doji, the positive trendline close and the 5/10 day crossover are friendly to prices and bullish. Overhead resistance could be pegged at the upper trendline, roughly 47.74 today, and that seems like a reasonable target. The July 5th high (48.87) and the November11th high (49.38) also seem like upper resistance targets to me. In my opinion, Bean Oil looks bullish.
March Soybean Oil (Weekly)
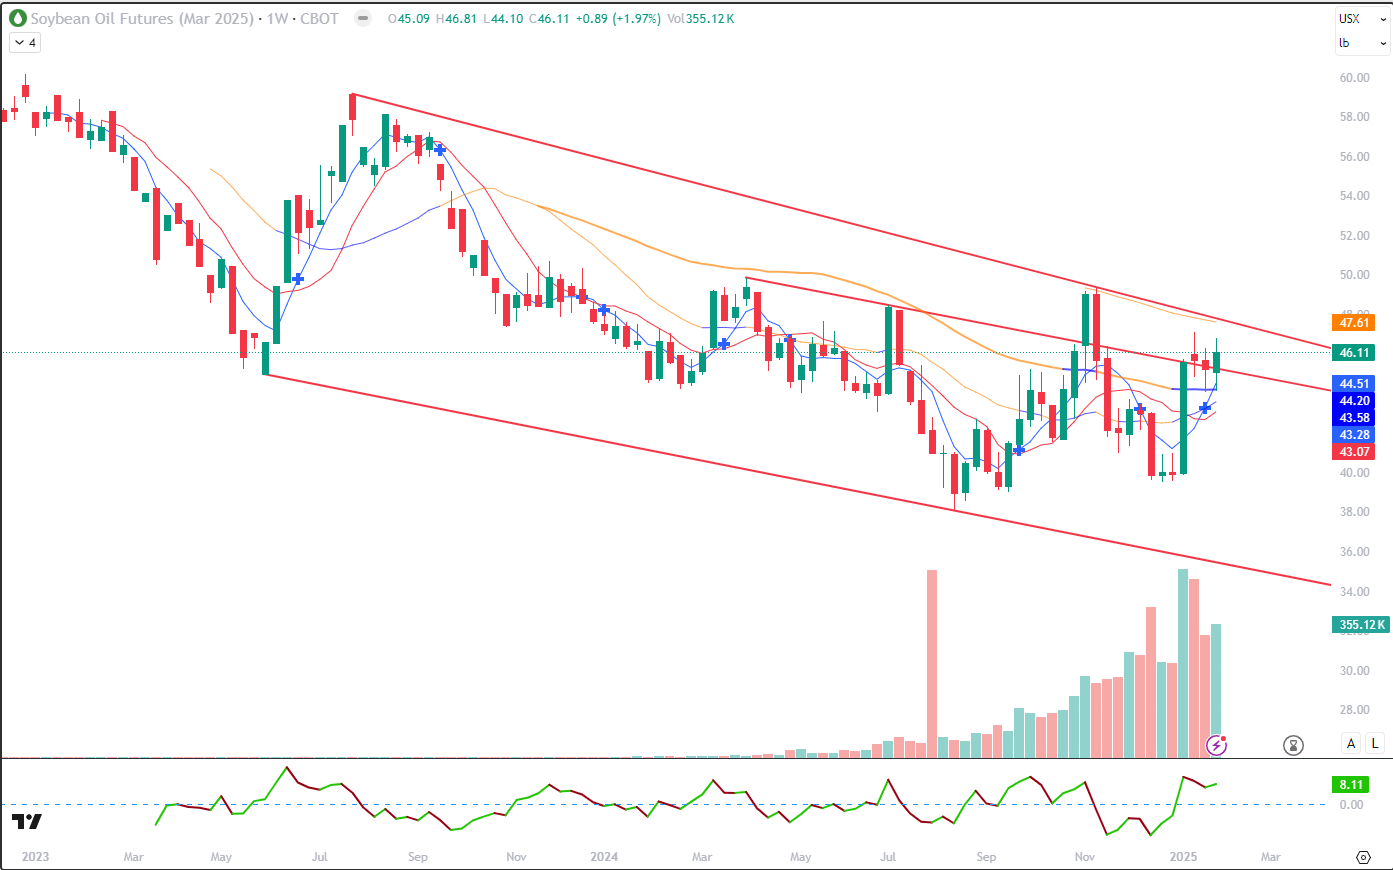
The weekly chart illustrates that Bean Oil has been in a downtrending channel for quite some time. This picture goes back 2 years. Prices have cleared the middle trendline and appear headed toward the upper. The 5- and 10-week moving averages made a bullish crossover with last weeks trade. Support has held for the past two weeks at the 50-week average, at 44.20 today. This chart tempers my bullishness a bit, but there is still room to the upside and the bulls have been in control of this market, for the most part, all month. Aggressive and well-margined traders may do well to consider long futures positions. Risk may be better managed by using Put options, rather than sell stops, given the tariff uncertainty.
March Soybean Oil (Seasonal)
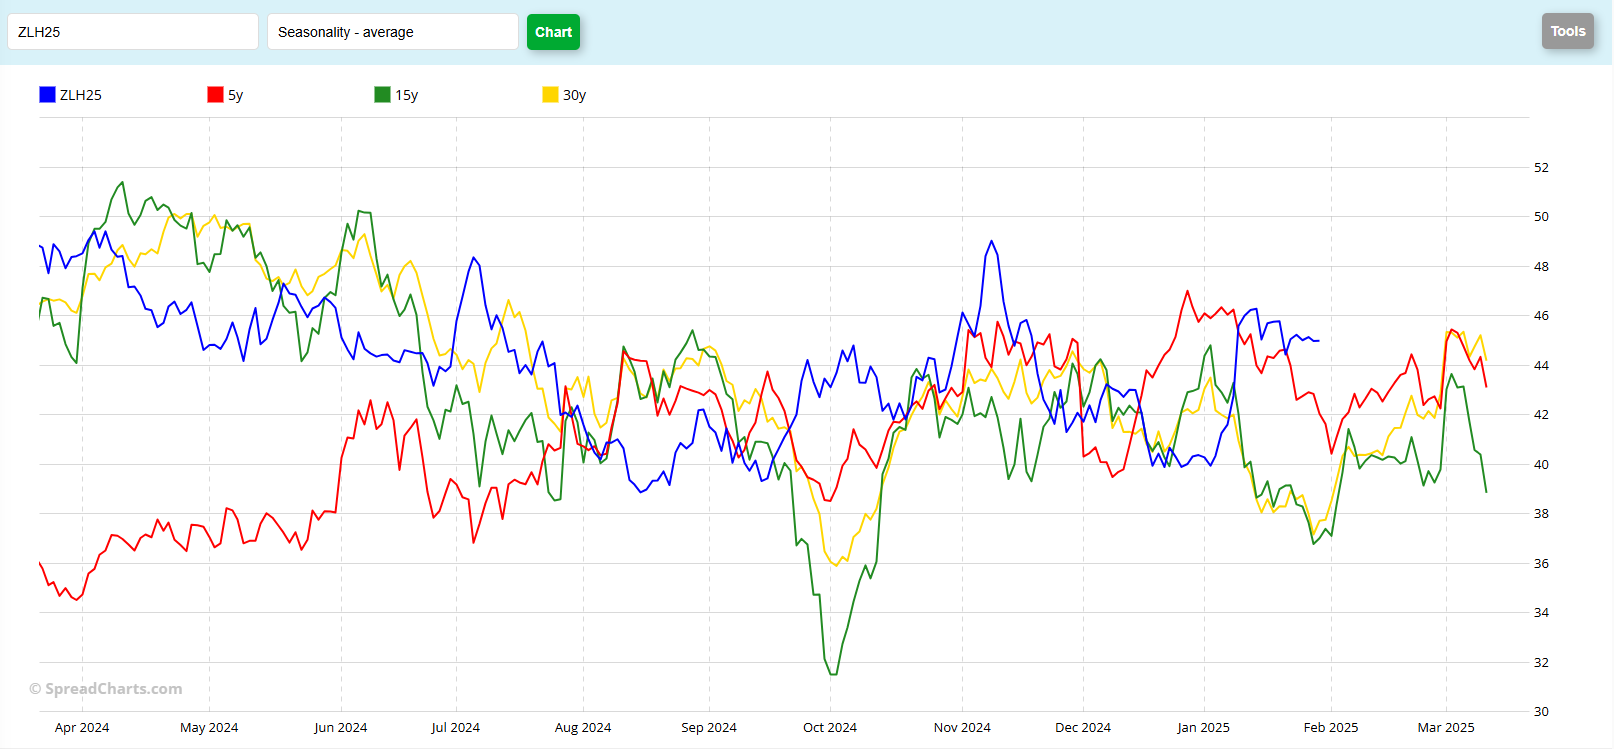
The seasonal pattern for Bean Oil, as we move forward, is unclear to me. You might notice that when “typically” expected to go in a direction, many times it’s been going the other. For instance, in October, when prices have been making lows over the past 5, 15 or 30 years, this contract was making highs. And in late December – early January, when prices historically peak, this contract was near the lows. As we move forward, Bean Oil prices tend to end February higher than where they began. What does this chart tell you?
Jefferson Fosse Walsh Trading
Direct 312 957 8248 Toll Free 800 556 9411
jfosse@walshtrading.com www.walshtrading.com
Walsh Trading, Inc. is registered as a Guaranteed Introducing Broker with the Commodity Futures Trading Commission and an NFA Member.
Futures and options trading involves substantial risk and is not suitable for all investors. Therefore, individuals should carefully consider their financial condition in deciding whether to trade. Option traders should be aware that the exercise of a long option will result in a futures position. The valuation of futures and options may fluctuate, and as a result, clients may lose more than their original investment. The information contained on this site is the opinion of the writer or was obtained from sources cited within the commentary. The impact on market prices due to seasonal or market cycles and current news events may already be reflected in market prices. PAST PERFORMANCE IS NOT NECESSARILY INDICATIVE OF FUTURE RESULTS. All information, communications, publications, and reports, including this specific material, used and distributed by Walsh Trading, Inc. (“WTI”) shall be construed as a solicitation for entering into a derivatives transaction. WTI does not distribute research reports, employ research analysts, or maintain a research department as defined in CFTC Regulation 1.71.