
The information and opinions expressed below are based on my analysis of price behavior and chart activity
March Soybeans (Daily)
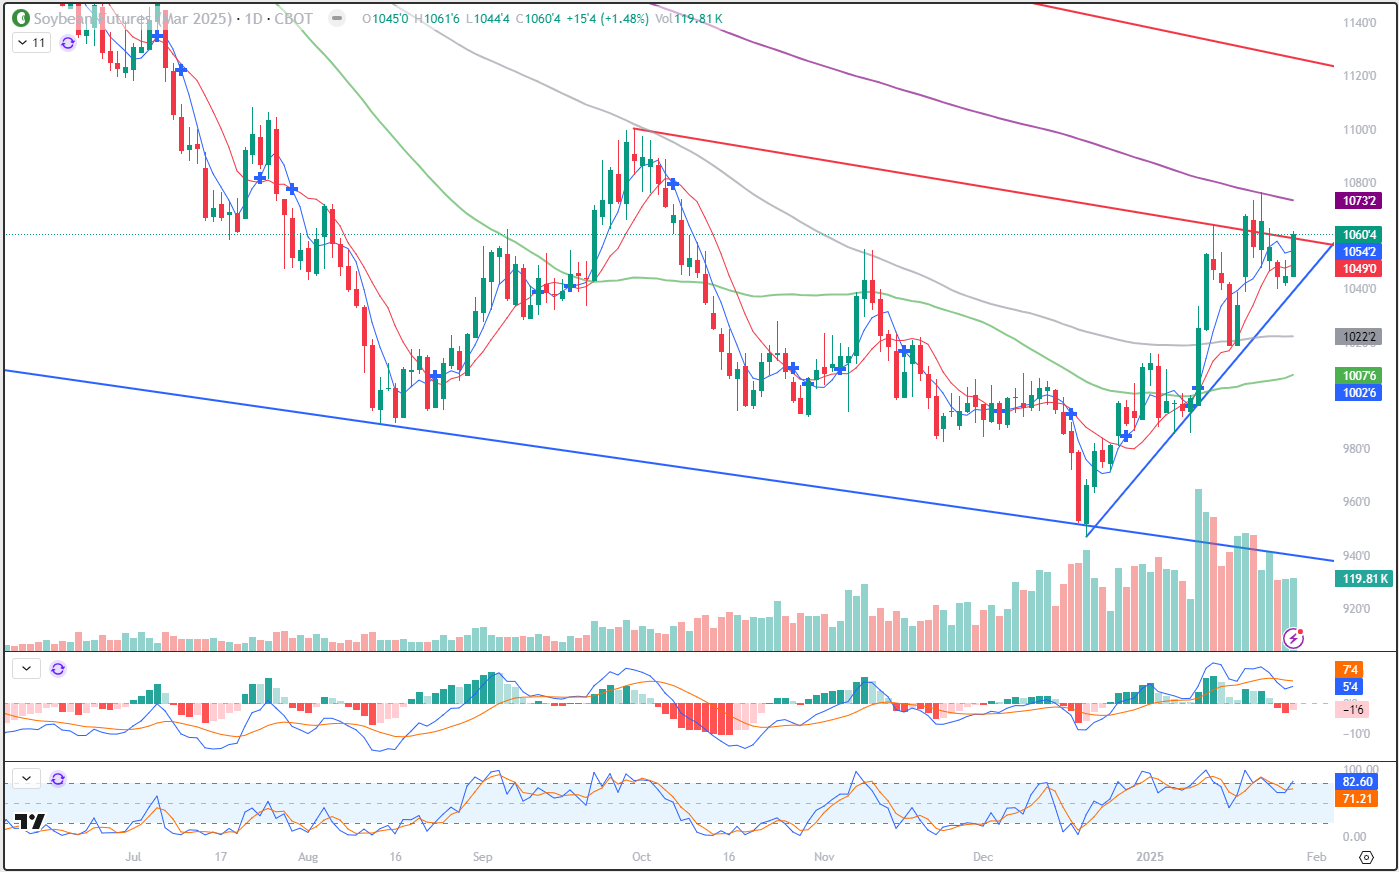
March Beans closed up 15 ½ cents on Wednesday, settling at 10.60 ½. Volume of almost 120,000 was decent, but today was also one of the lowest volume days of the month, so far. You can see the volume displayed on the chart above, at the bottom of the price chart, not in one of the sub-graphs. Last week saw the Beans hit the 200-day moving average (purple) and settle back some. It appears that yesterday’s and today’s lows came close to trendline support (blue horizontal, uptrending) in a very similar way that the market did 8-9 sessions ago. You might notice that those two days saw the market interact with the 100-day moving average, finding support and buyers there. All three days this week, prices have flirted with that trendline and today traders bid the market back up. You’ll notice that we closed above trendline resistance (red horizontal, downtrending) which today is located near 10.59. Beans also closed above the 5-and 10-dauy moving averages, at 10.54 ¼ and 10.49, respectively. Those levels may offer some support, as we move forward. I see potential resistance near the 200-day average (10.73 ¼) and last Thursday’s high of 10.76 ¼. Beyond that, the Sept 30 high of 11.00 ¼ comes into play. Coincidentally, that nicely fits with a big, fat, round number. I may be mistaken about that, but markets seem to gravitate toward those round numbers, to my recollection. If Beans can successfully get through those levels, perhaps a test of that upper trendline, way up at 11.25 or so today, is in the cards.
I don’t see much in the way of “new” news out there. It’s still summer in Argentina and Brazil. That translates to high temps (Argentina) and untimely rains in some areas of Brazil. The gist of that, to my eye, is that yields may suffer a little. I don’t believe, at this time, that any reduction in yield from South America will be huge or meaningful. There is much talk and uncertainty regarding the possibility of 25% tariffs against Canada and Mexico being implemented this weekend. After all, Feb 1 is Saturday and that’s that date that Trump has hinted at. There’s been very little actual information from the administration about that and a whole lot of speculation from folks that don’t actually know. For now, I’ve adopted the point of view that until they are officially announced, they aren’t happening. Also, given the way that the nation of Columbia reacted to just the threat of tariffs this past weekend, they may force some changes in behavior before they are in place. In Columbia’s case, those threats turned out to be a valuable tool. Perhaps the others, if they materialize, will as well.
March Soybeans (weekly)
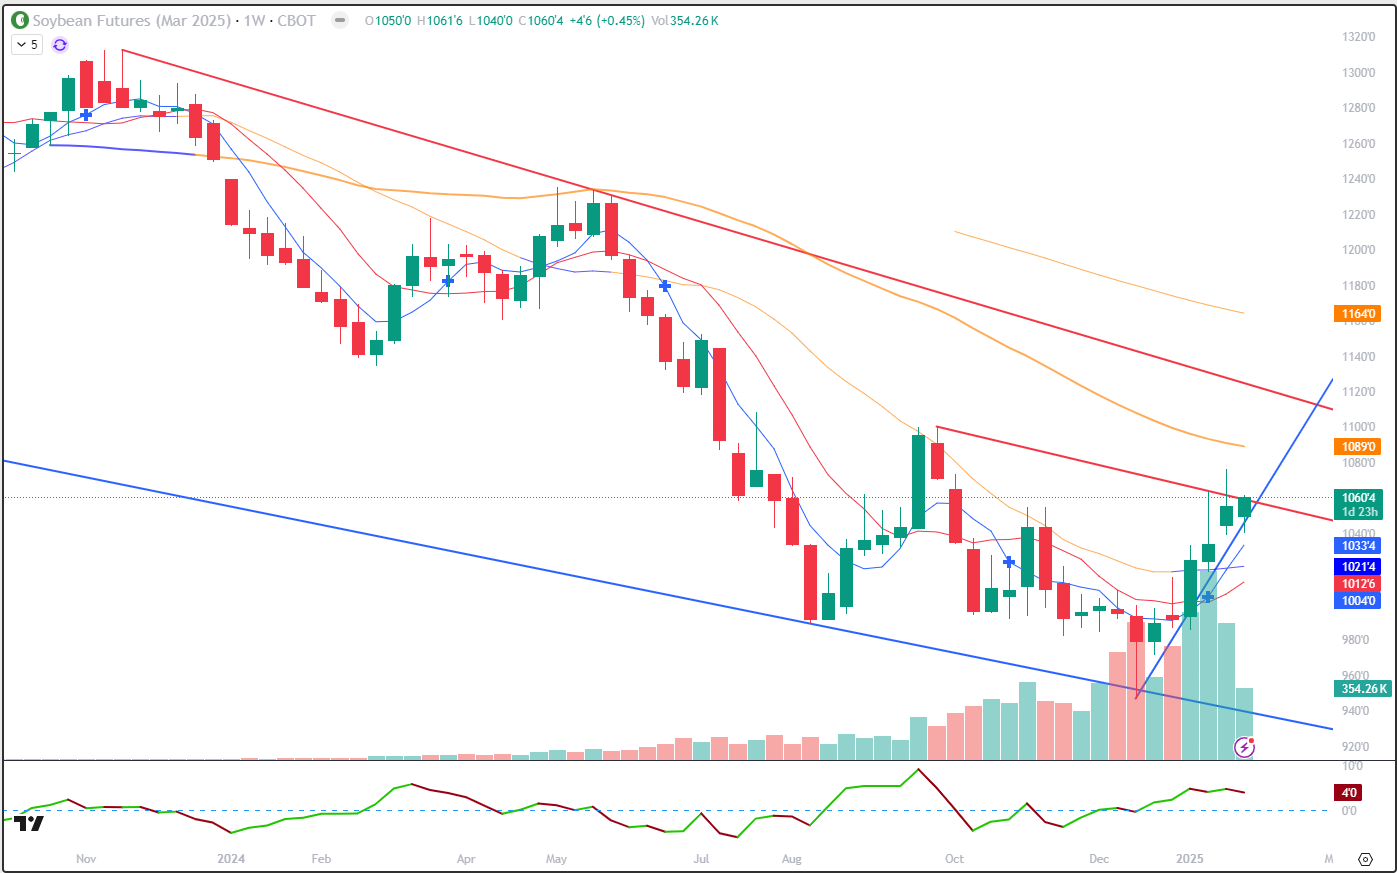
My weekly chart of March Beans shows that the market is still in a downtrend. The market has turned up since setting the low the week beginning Dec16th. 3 weeks, or bars, ago, the 5-and 10-week moving average crossed to the bullish side, which is friendly. This chart has the same trendlines as the one above. You’ll notice that this week is kind of wedged into a corner between the recent downtrend (red horizontal) and the very recent uptrend (blue uptrending) Does it fail here and head back down or does it keep going up to the next corner? My take is that it keeps going up for now. I think that next corner on the chart, near 11.25 today, is a reasonable target. The September highs, right around the 11.00 mark, and the 150-week average, at 10.89 may offer some weekly resistance before we get there. While it’s not wildly bullish, I believe that the fundamentals support some somewhat higher prices. I don’t think those gains will stick once Brazilian harvest really gets rolling. Perhaps tariffs could be a bearish influence, as well, but we’ll have to wait and see.
March Soybeans (Seasonal)
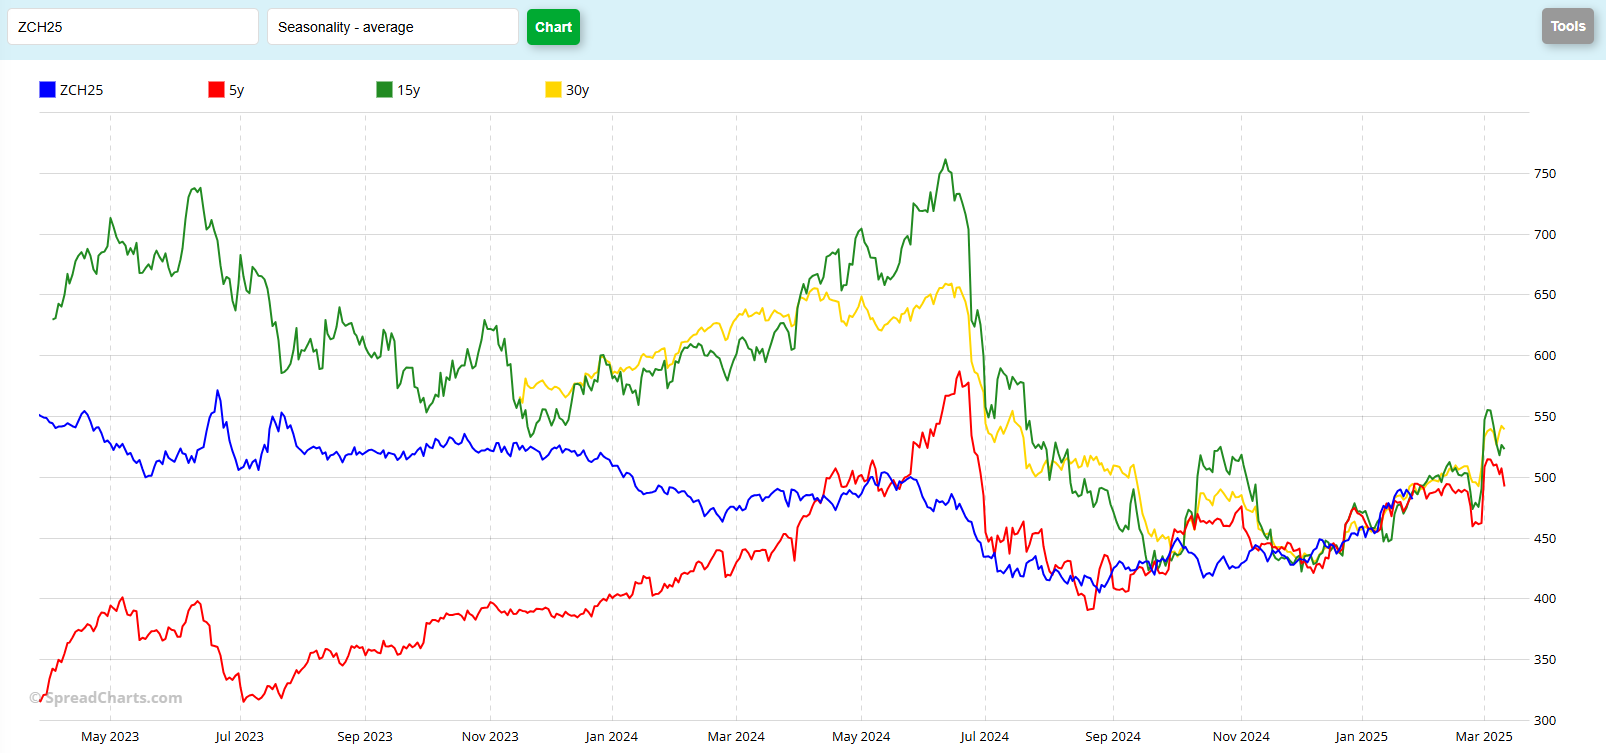
My seasonal chart indicates to me that we should expect strength until roughly Valentine’s Day. I’ll be the first to tell you that the seasonals don’t always “work” and the Soybeans are no exception to that. Before the market made its lows in August last fall, you might notice the large divergence between this contracts trade and past years. That was a period when they didn’t work. But since that August low, the seasonals have been tracking pretty closely with past 5-, 15-, and 30-year patterns.
Jefferson Fosse Walsh Trading
Direct 312 957 8248 Toll Free 800 556 9411
jfosse@walshtrading.com www.walshtrading.com
Walsh Trading, Inc. is registered as a Guaranteed Introducing Broker with the Commodity Futures Trading Commission and an NFA Member.
Futures and options trading involves substantial risk and is not suitable for all investors. Therefore, individuals should carefully consider their financial condition in deciding whether to trade. Option traders should be aware that the exercise of a long option will result in a futures position. The valuation of futures and options may fluctuate, and as a result, clients may lose more than their original investment. The information contained on this site is the opinion of the writer or was obtained from sources cited within the commentary. The impact on market prices due to seasonal or market cycles and current news events may already be reflected in market prices. PAST PERFORMANCE IS NOT NECESSARILY INDICATIVE OF FUTURE RESULTS. All information, communications, publications, and reports, including this specific material, used and distributed by Walsh Trading, Inc. (“WTI”) shall be construed as a solicitation for entering into a derivatives transaction. WTI does not distribute research reports, employ research analysts, or maintain a research department as defined in CFTC Regulation 1.71.