The information and opinions expressed below are based on my analysis of price behavior and chart activity
March Soybeans

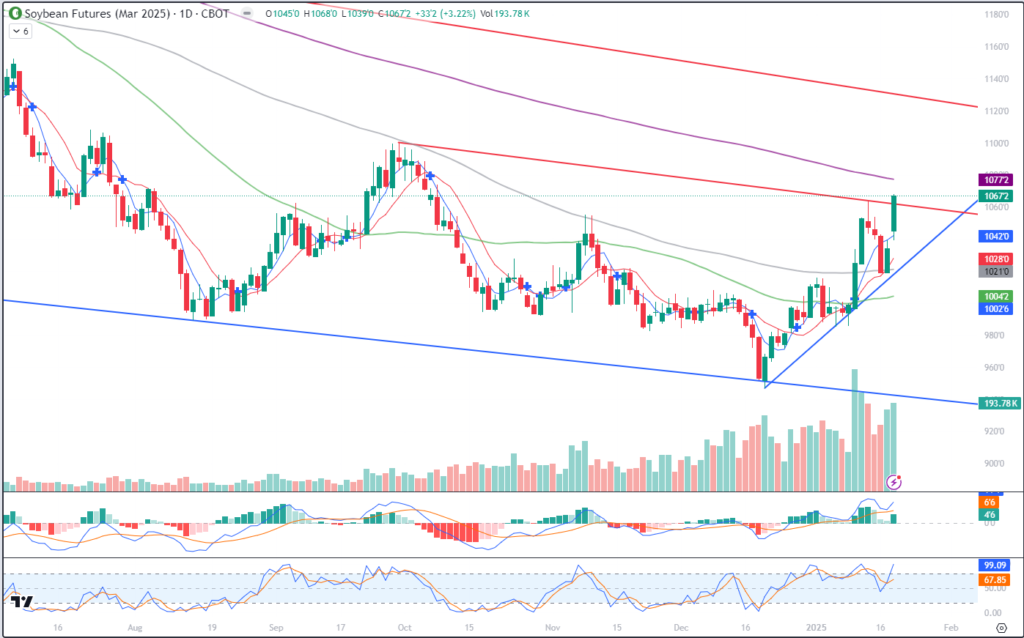
March Beans started the 1st session of a new presidency by rallying some 33 ¼ cents to close at 10.67 ¼. From what I’ve been able to glean from the news articles coming across my screens today, it seems that fears of “insta-tariffs” were a bit overblown. It appears that while President Trump is still on board with instituting new taxes on imports, he’s taken a position that requires examination of current tariffs, trade practices and the like, BEFORE adding new tariffs. I am, by no means, a tax expert, but that type of approach makes sense to me. Before lighting the world on fire, let’s see what needs burning first and focus on that. That mentality was rewarded by the Grain markets today, with strength and green prices (nearly) across the board. Soybean Oil was mildly firmer today through the October contract only.
Soybean prices have rallied about 1.20 over the past month, from the Dec 19th low at 9.47. While Stochastics (bottom sub-graph) are heading toward overbought conditions, they are not there yet and that still leaves room to the upside, in my opinion. You’ll notice the first red trendline on the chart above. That was drawn off of the high from Sept 30th (11.00 ¼) and this past Tuesday (10.64) Trade this morning went right to that trendline at the 8:30 open, before trading back to set the day-session low at about 9:45. When that trendline was re-visited at about 12:45, it turned into support and prices set new highs into the close. Normally, once a trendline is broken, I’ll remove it from the chart. However, I’ll leave this one here for a few days and see if it becomes a valid support level. Today, that trendline is near the 10.62 mark. The 5-day moving average offered support near today’s low and is valued near 10.42 today. The 10-day average is down near 10.28 and the 100-day average is coinciding nicely with the nearest blue trendline support, near 10.21. The nearest overhead resistance that I see is the 200-day moving average at 10.77 ¼ today. Beyond that, I would expect the big, fat, round number of 11.00 to offer resistance. Not only because it’s a big round number, but that also coincides with the September 30th high, at 11.00 ¼. Long-term trend resistance shows up on my chart in the form of that overheard trendline. That trendline value intersects, roughly, at 11.30, today. That trendline is drawn off of the November 2023 high (13.12 ½) and the May 2024 high (12.33 ¾) Keeping in mind that current expectations for Brazil’s bean crop are very large, right now. The Jan 10th WASDE report from the USDA indicated that the gov’t expects Brazilian production to increase to 169 million metric tons, a sizable increase over last year’s production, which was pegged at 153 million metric tons. High input costs here in the US have farmers sharpening their pencils as we all look forward to planting season. If the South American weather turns against the crop, we could see prices move above that 11.20-11.25 level. Weather is weather – we can’t control it, but at this moment, I don’t see that happening. And there is still much uncertainty that comes with the new US administration. I’ve read articles that are convinced that his last presidency took 25-30% out of the Ag markets. Many folks are expecting a similar result this time around. Personally, I’m not sure. We’ll have to wait and see how that goes.
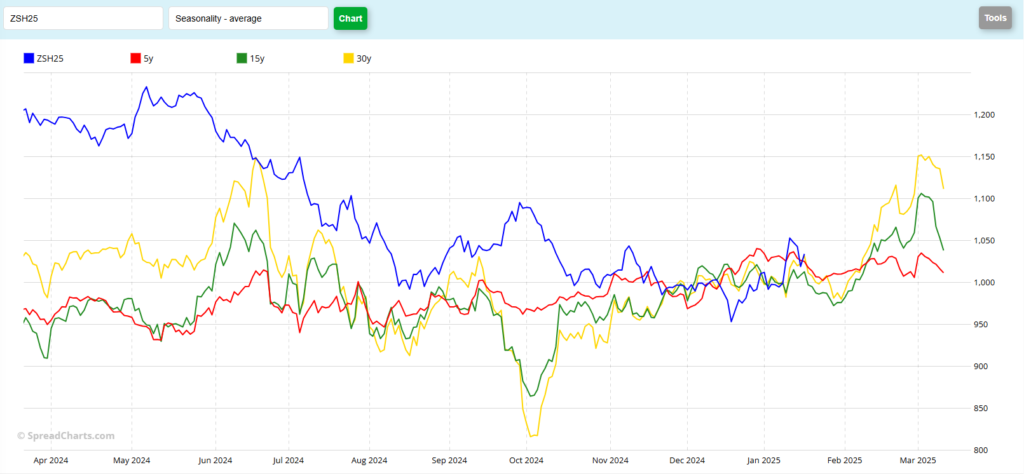
Seasonally speaking (chart below) it appears that Soybeans usually get weaker until the end of January, before beginning a rally that extends until the March approaches First Notice Day and contract rollover begins. But to my eye, we haven’t really tracked with the seasonals in Soybeans for quite some time. Sure they may seem to track from time to time, but for the most part, I don’t think they do. For example, current prices rallying when historical data indicate the opposite (Sept-Oct). Or the dip to new contract lows in December, when prices historically should be gaining. Or prices rallying now, when seasonals show weakness in Januarys’ past.
March Soybean Seasonal

Jefferson Fosse Walsh Trading
Direct 312 957 8248 Toll Free 800 556 9411
jfosse@walshtrading.com www.walshtrading.com
Walsh Trading, Inc. is registered as a Guaranteed Introducing Broker with the Commodity Futures Trading Commission and an NFA Member.
Futures and options trading involves substantial risk and is not suitable for all investors. Therefore, individuals should carefully consider their financial condition in deciding whether to trade. Option traders should be aware that the exercise of a long option will result in a futures position. The valuation of futures and options may fluctuate, and as a result, clients may lose more than their original investment. The information contained on this site is the opinion of the writer or was obtained from sources cited within the commentary. The impact on market prices due to seasonal or market cycles and current news events may already be reflected in market prices. PAST PERFORMANCE IS NOT NECESSARILY INDICATIVE OF FUTURE RESULTS. All information, communications, publications, and reports, including this specific material, used and distributed by Walsh Trading, Inc. (“WTI”) shall be construed as a solicitation for entering into a derivatives transaction. WTI does not distribute research reports, employ research analysts, or maintain a research department as defined in CFTC Regulation 1.71.
