The information and opinions expressed below are based on my analysis of price behavior and chart activity
Tuesday, November 12, 2024
January Soybeans

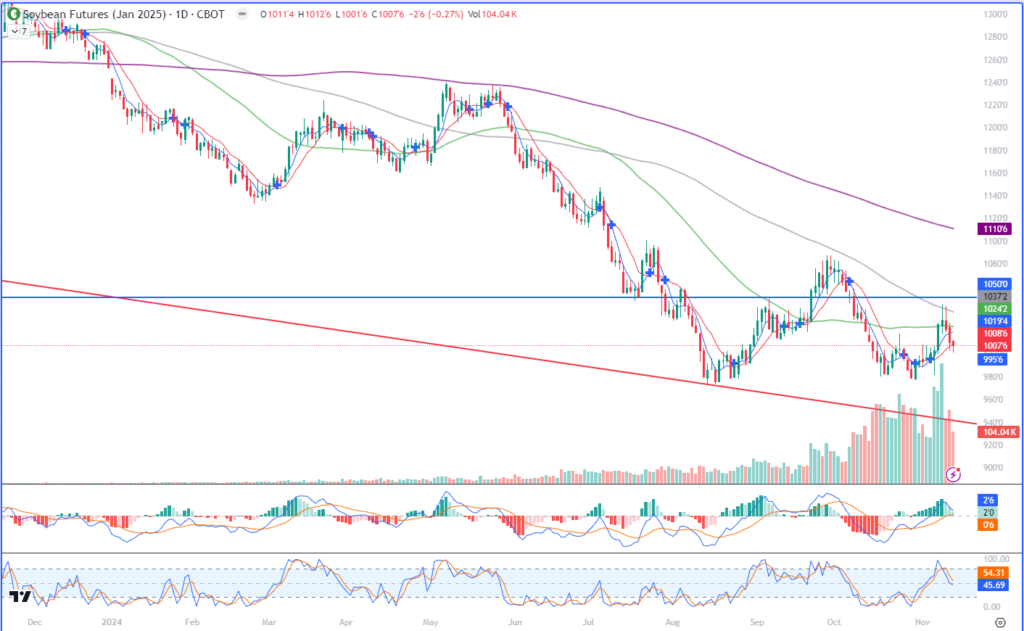
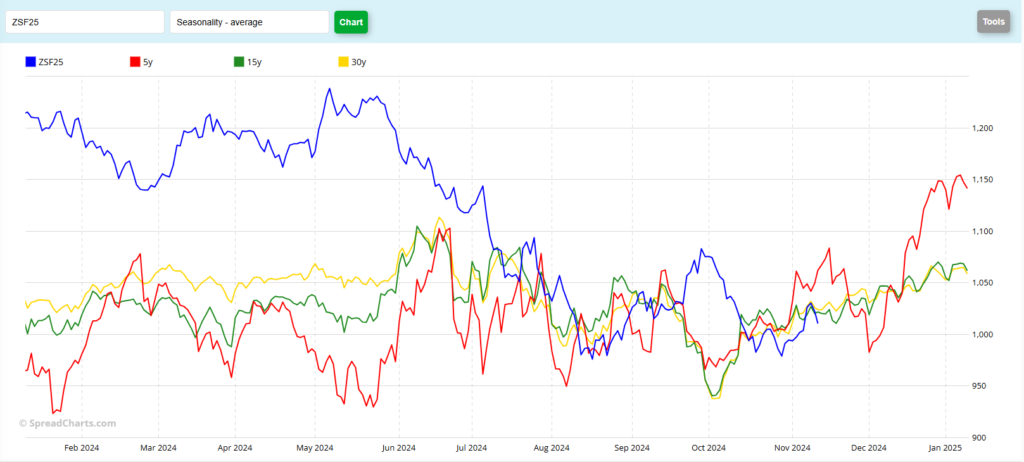
This week, the January Soybean contract has been working it’s way lower, following last Friday’s monthly USDA report. Prices did get up to 10.44 after the report was released, but a lack of “new” news has subsequently sent prices back lower, in what I believe to be a bout of profit taking. On Friday, the USDA confirmed (again) that we’ll have a big Soybean crop in the US this year. They did not make any huge cuts to production estimates or raise demand estimates and they lowered the average yield bay a very small amount. That shouldn’t be news to anyone that has been following the market. (If you need details of what the report said, give me a call and I’ll share what I know, but not doing that in this space today.) Today, the January contract settled at 10.07 ¾, down 2 ¾ on the day and down 22 ½ for the week, so far. Trade volume for the past three sessions has been a bit lighter than last week. You can see that in the subgraph immediately below the price chart. To my eye, that tells me that the move lower this week has been more profit taking, as opposed to new selling pressure. Seasonally, Soybeans tend to rally until expiration, but as you can see by the chart below, they don’t do it in a straight line. And while this illustrates the seasonal tendency compared to the past 5, 15 and 30 years, as you can also see by the chart, the market doesn’t always hold to the seasonal pattern. You’ll notice the divergence this past summer.

In my opinion, the low may have been made in Soybeans. I’m not wildly bullish and don’t expect to see a huge jump in prices, compared to what we’ve seen during Covid and as a result of the Russia/Ukraine war, but I don’t see any real reason for prices to go substantially lower. Harvest is nearly complete and the crop size is known. All that’s left to influence price now is demand, or lack of it. The recent Export Inspections report, normally released on Monday, show that our pace of export shipments is above last year’s pace by almost a million metric tons. There has been some talk of “tariff uncertainty” with the the incoming Trump administration, but I think that may spur more foreign demand before he takes office, which should be bullish for prices. I think that other countries may want to book their purchases before any Trump tariffs actually materialize. Those tariffs, if and when they do occur, may not actually have an effect on our Ag exports. A more troubling headwind to exports is the recent strength in the US Dollar, but that’s a story for another chart, I think. Aggressive and well-margined traders may do well to consider long positions, with an initial target near 10.50 (blue horizontal on the 1st chart) with a further target near the September 30th high of 10.87 ½. Beyond that, perhaps 11.00 and the 200 day (purple) moving average at 11.10 ¾. The does appear to be some overhead resistance near the 50 (green) and 100-day moving averages (grey) near 10.24 ¼ and 10.37 ¼ today. Both of those averages seemed to have capped last week’s strength and we are trading below them. But, as the market did not set new lows when it pulled back in October, I am of the opinion that we are beginning a longer upswing in prices. Depending on when/where you enter the market, I would set your risk at 20-25 cents under your entry. Basically, risk the low from October 30th at 9.77 ¼. You can protect that risk either by using a Stop order against your futures position, or by using the options, if you’re worried about getting “stopped out.” For a strategy that is custom fit for your operation, risk tolerance and capitalization level, please contact me directly.
Jefferson Fosse
Walsh Trading
Direct 312 957 8248
Toll Free 800 556 9411
Walsh Trading, Inc. is registered as a Guaranteed Introducing Broker with the Commodity Futures Trading Commission and an NFA Member.
Futures and options trading involves substantial risk and is not suitable for all investors. Therefore, individuals should carefully consider their financial condition in deciding whether to trade. Option traders should be aware that the exercise of a long option will result in a futures position. The valuation of futures and options may fluctuate, and as a result, clients may lose more than their original investment. The information contained on this site is the opinion of the writer or was obtained from sources cited within the commentary. The impact on market prices due to seasonal or market cycles and current news events may already be reflected in market prices. PAST PERFORMANCE IS NOT NECESSARILY INDICATIVE OF FUTURE RESULTS. All information, communications, publications, and reports, including this specific material, used and distributed by Walsh Trading, Inc. (“WTI”) shall be construed as a solicitation for entering into a derivatives transaction. WTI does not distribute research reports, employ research analysts, or maintain a research department as defined in CFTC Regulation 1.71.
