
Commentary:
There is talk within the trade that crop conditions are improving in South America somewhat, especially in Brazil. If crop estimates stop declining in South America, it’s my view that funds may limit new buying, especially in soybeans. IHS Markit raised its Brazilian soybean crop estimate by 500,000 MT to 133 MMT, noting positive productivity surprises in states like Goias, Mato Grosso do Sul and Minas Gerais. The firm is the latest to issue a crop peg in the 133 MMT vicinity. with USDA projecting Brazil’s soybean crop at 133 MMT. On the high side, Datagro raised its production estimate 630,000 MT to 135.61 MMT this week.
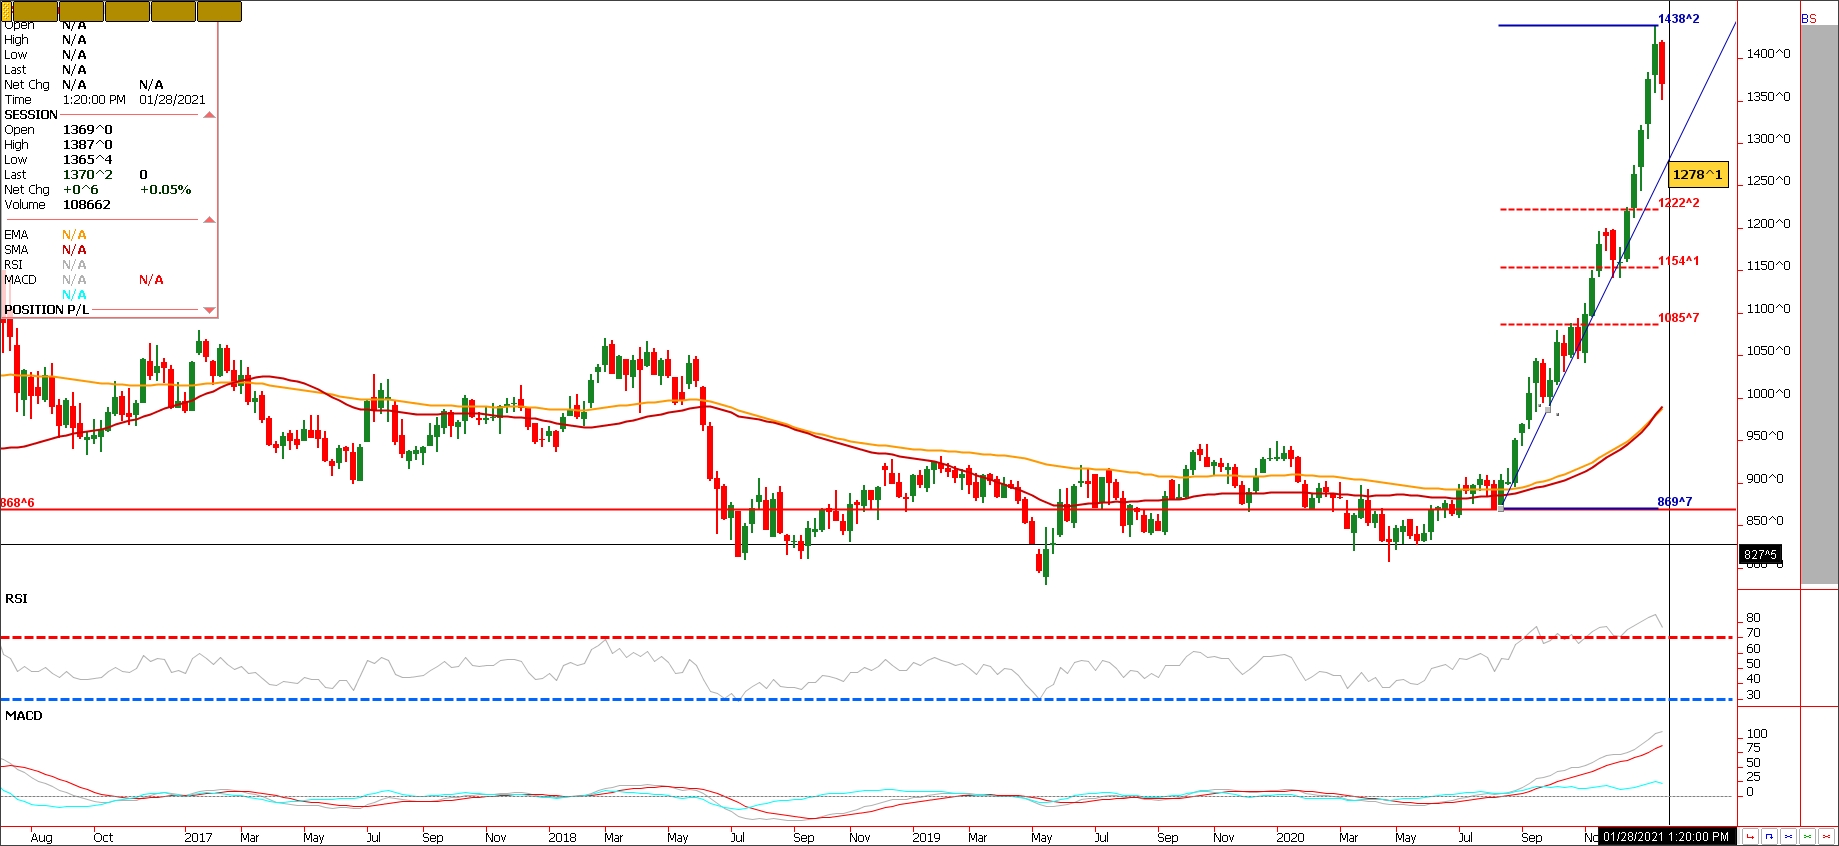
That maybe enough to offset what has been insatiable demand for now. Since the August lows, the bean market has rallied $5.70 a bushel. A massive rally but with prices falling below 14.00, and a sizable long in the market, an unwind and profit take maybe coming. For all of 2020, China imported 25.89 million metric tons of soybeans from the U.S up 52.8 percent from 2019. Before the reopening this morning, USDA announced private exporters sold 136,000 MT of soybeans to China and 163,290 MT of soybeans to Mexico, both for old-crop delivery. However the overnight rally that pushed March futures to 1387, slowly dissipated throughout today’s session, and soybeans finished flat on the day at 1370 basis March futures. We have seen rallies the last few days emerge as selling opportunities. See chart. At some point, I see the market trading down to the fifty percent retracement level seen on the chart. The question is when? It could be late February, or after the 4th of July, or next year. Weather most likely will be the determinant but don’t rule out something entering into the market changing the psychology of the trade. Of course conditions in Argentina could turn for the worse, and dips in the grain sector may simply emerge as buying opportunities. Watch the technical action in beans. We closed last year 2020 at 1311.Five percent higher is at 1376. (Achieved). 1442 is ten percent higher on the year and the market traded to a hair below making a high last week at 1438. Under 1311 and 1245 maybe the next target as that level is 5 percent down while 10 percent down sits at 1180, with the 50 percent retracement from the August lows to last week’s highs down at 1154. (See chart) I am suggesting a three way option strategy. It is defined risk upon entry using May 21 options that expire in 91 days as of this post. Please take a look and call me with any questions.
rade Idea
Futures-N/A
Options-Buy the May 21 soybean 12.00 put and at the same time sell the 11.00/12.00 call spread. Bid -90 cents on the three way option strategy to enter.
Risk/Reward
Futures-N/A
Options-the maximum loss on this trade is $1.00 or 5K plus commissions and fees. However if filled at -90 cents, one is collecting -4500 upon entry minus commissions and fees. That makes the maximum risk ten cents or $500.00 plus trade costs and fees. In short we are taking approx. 10 cents risk to hold a static short for the next 90 days to see a potential deep correction in the Soybean complex into Spring.
Please join me for a free grain and livestock webinar every Thursday at 3pm Central. Sign up is free and a recording link will be sent upon signup. We discuss supply, demand, weather, and the charts. Sign Up Now
Walsh Trading, Inc. is registered as a Guaranteed Introducing Broker with the Commodity Futures Trading Commission and an NFA Member.
Futures and options trading involve substantial risk and is not suitable for all investors. Therefore, individuals should carefully consider their financial condition in deciding whether to trade. Option traders should be aware that the exercise of a long option will result in a futures position. The valuation of futures and options may fluctuate, and as a result, clients may lose more than their original investment. The information contained on this site is the opinion of the writer or was obtained from sources cited within the commentary. The impact on market prices due to seasonal or market cycles and current news events may already be reflected in market prices. PAST PERFORMANCE IS NOT NECESSARILY INDICATIVE OF FUTURE RESULTS.
All information, communications, publications, and reports, including this specific material, used and distributed by Walsh Trading, Inc. (“WTI”) shall be construed as a solicitation for entering into a derivatives transaction. WTI does not distribute research reports, employ research analysts, or maintain a research department as defined in CFTC Regulation 1.71.
Sean Lusk
Vice President Commercial Hedging Division
Walsh Trading
312 957 8103
888 391 7894 toll free
312 256 0109 fax
Walsh Trading
53 W Jackson Suite 750
Chicago, Il 60604